
Figures & data
Figure 1 Study design.
Abbreviation: MITT, multiple-inhaler triple therapy.
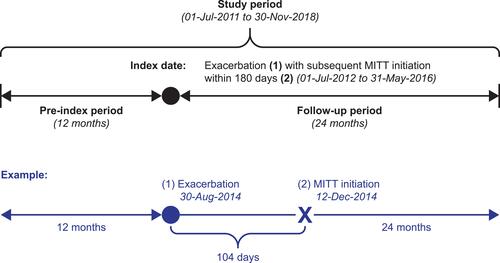
Figure 2 Consort diagram for study sample.
Abbreviations: COPD, chronic obstructive pulmonary disease; GOLD, Global Initiative for Chronic Obstructive Lung Disease; MITT, multiple-inhaler triple therapy.
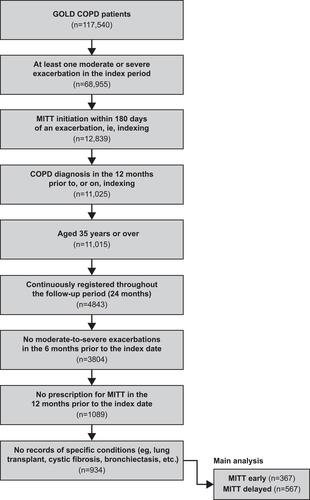
Table 1 Baseline Demographics and Clinical Characteristics of Study Cohort
Table 2 All-Cause and COPD-Related HCRU in the 12 and 24 Months Following MITT Initiation for Early (≤30 Days) versus Delayed (31–180 Days) MITT Initiators
Figure 3 All-cause and COPD-related direct healthcare costs following MITT initiation in early (≤30 days) versus delayed (31–180 days) MITT initiators, at (A) 12 months and (B) 24 months, following MITT initiation.
Notes: Early versus delayed MITT initiators: *p<0.05; **p<0.01; ***p<0.001.
Abbreviations: A&E, Accident & Emergency; COPD, chronic obstructive pulmonary disease; GP, general practitioner; MITT, multiple-inhaler triple therapy.
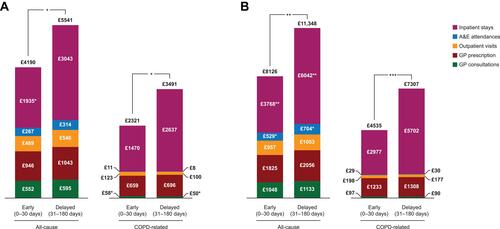
Table 3 Frequency of Exacerbations in the 12 and 24 Months Following MITT Initiation for Early (≤30 Days) versus Delayed (31–180 Days) MITT Initiators