
Figures & data
Figure 1 Distribution of the study subjects and propensity score matching.
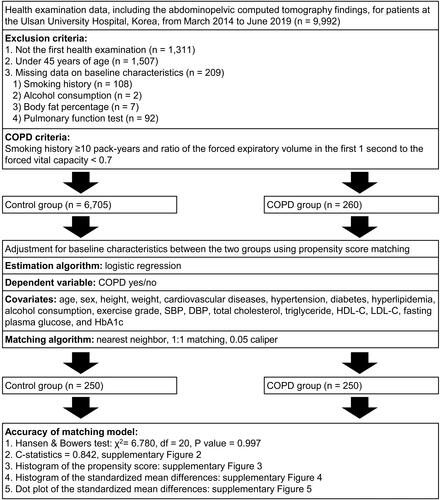
Table 1 Baseline Characteristics of the Study Subjects After Propensity Score Matching
Figure 2 Distribution of the abdominal body compositions between the control and chronic obstructive pulmonary disease groups in the propensity score matching cohort. (A) Comparison of the attenuations for abdominal fat and muscle, (B) Comparison of the body mass index adjusted cross-sectional areas for abdominal fat and muscle.
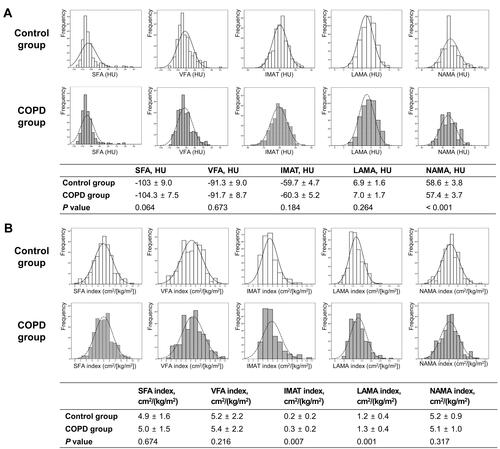
Table 2 Abdominal Body Fat and Muscle Composition Analysis Results for the Chronic Obstructive Pulmonary Disease Group Compared with the Control Group
Table 3 Abdominal Body Fat and Muscle Composition Analysis Results for the Chronic Obstructive Pulmonary Disease Subgroups Compared with the Control Group