Figures & data
Figure 1 Flow Chart of Data Processing for 4 GSEs.
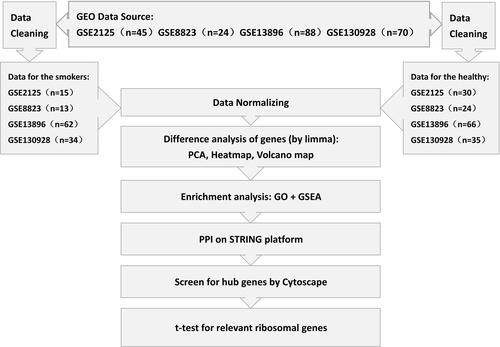
Figure 2 PCA of 4 GSEs before and after Batch Effect Adjustment. The 4 datasets unprocessed (against Batch Effect) are shown divergently by means of PCA (A); After the adjustment allowing for the Batch Effect, the datasets are integrated by the COPD smokers and the non-COPD smokers and the inherent difference can be sharpened (B). The colored dots represent the probes corresponding to relevant genes symbolically and quite a number of genes are differently distributed between the groups (B). The identical process of PCA was applied to the non-COPD groups with the unprocessed data shown (C). As the normalized data is displayed, there is only a limited but definite difference of gene expression between the non-smokers and the non-COPD smokers (D).
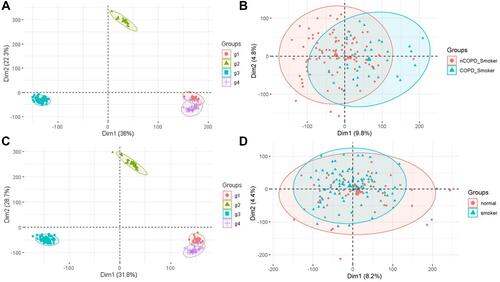
Table 1 The Top 10 Genes with Most Significant Difference of Transcription Between Relevant Groups
Figure 3 The Visualization of Differently Expressed Genes Between Relevant Groups. According to logFC, the Heatmap (A) displays the top 40 of differential genes expressed (both upregulated and downregulated) between the COPD smokers and the non-COPD Smokers. With the default logFC (0.585) and P value (0.05), the volcano plot (B) shows the top 20 differential expression of relevant genes. Likewise, the Heatmap (C) displays the top 40 differential genes upregulated or downregulated between the non-COPD smokers and the non-Smokers. With the same default of logFC and P value, the volcano plot (D) shows the top 20 differential expression of relevant genes.
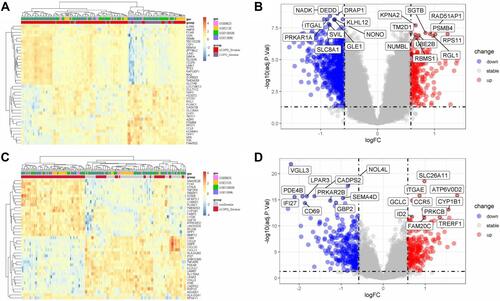
Table 2 The Top 10 of Most Significant Pathways Between Relevant Groups
Figure 4 GO Enrichment Analysis of AM Between Relevant Groups. (A–C) GO comparison of the COPD Smokers and the non-COPD Smokers; (A) for Cell Components (Top 10), (B) for Biological Process (Top 10), (C) for Molecular Function (Top 10). (D–F) GO comparison of the non-COPD Smokers and the non-Smokers; (D) for Cell Components (Top 10), (E) for Biological Process (Top 10), (F) for Molecular Function (Top 10).
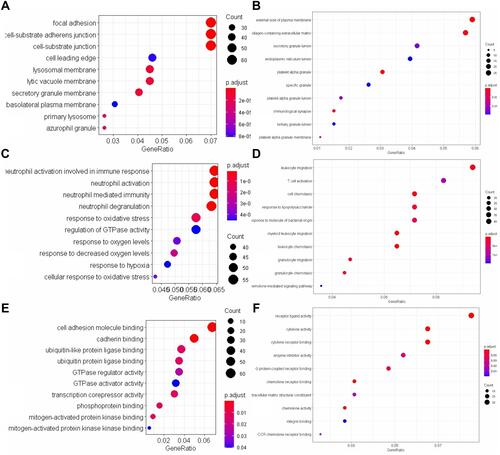
Figure 5 GSEA of AM Between Relevant Groups. (A) GESA for the non-COPD Smokers vs COPD Smokers. The blue-colored part on the left represents the relatively down-regulated pathways according to the enrichment analysis by GSEA, while a few of the red-colored parts represent the relatively up-regulated pathways. The default cutoff of P value is 0.05, with a total of more than 120 pathways being achieved, thus only pathways with P value <0.005 are shown here. (B) GSEA for the non-Smokers vs non-COPD Smokers. The blue-colored part on the left represents the relatively down-regulated pathways according to the enrichment analysis by GSEA, while a few of the red-colored part represent the relatively up-regulated pathways. The default cutoff of P value is 0.05, with a total of 50 pathways being achieved. The trend of up- or down- regulated is based on the algorithm of functional class scoring (FCS).
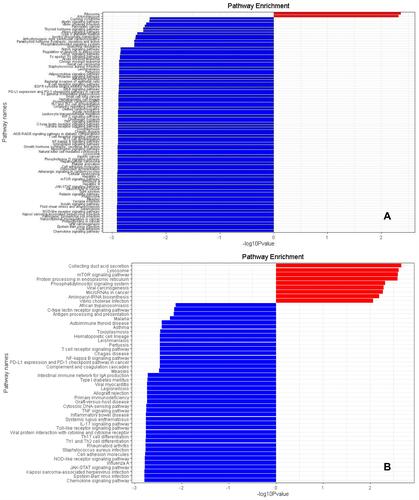
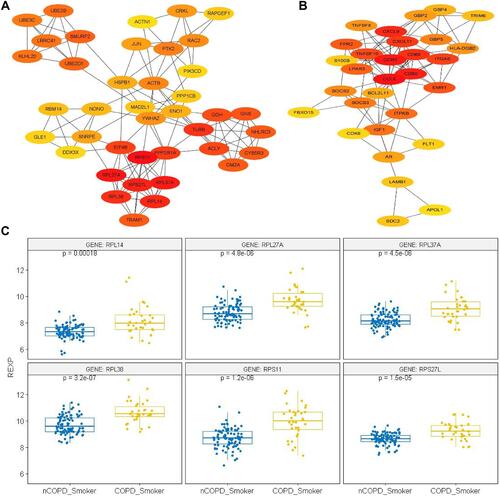
Figure 6 Protein–Protein Interaction Network and Hub gene Expression. All of the nodes could be regarded as hub-genes of the relevant network in (A and B). (A) PPI comparison of the Cytoscape between the COPD and non-COPD Smokers. The Hub genes have been displayed as the color nodes. The most deep-colored are RPL27A, RPL14, RPL37A, RPL38, RPS11 and RPS27L, signifying the most concentrated genes of the network. (B) PPI comparison of the non-COPD smokers and non-smokers. The most deep-colored are CCL5, CCR5, CXCL9 and CXCL11, signifying the most concentrated genes of the network. (C) The expression of ribosome-encoding genes such as RPS11, RPL14, RPL27A, RPS27L, RPL37A and RPL38 between the COPD and non-COPD Smokers. All of these genes in COPD Smokers have been remarkably up-regulated, with RPL38 being most significant, with a P value of 3.2×10⁻⁷.