Figures & data
Figure 1 Overview of the study population.
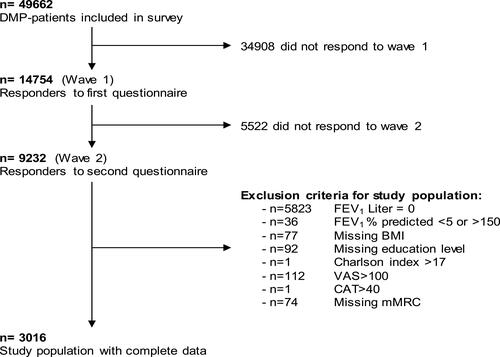
Table 1 Baseline Characteristics of Participants Who Experienced a Minimal Important Difference Deterioration in VAS (≥-6.9) and CAT (≥+2)
Table 2 Change in FEV1, Exacerbations and HRQoL for 3016 Patients Who Completed Both Questionnaires
Figure 2 Proportion of HRQoL change with a Minimal Important Difference (MID).
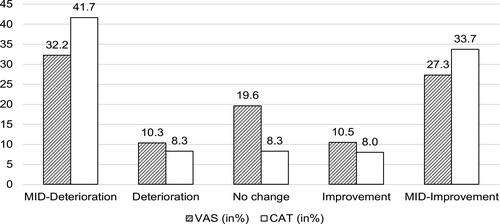
Figure 3 Determinants of a clinically relevant deterioration in generic HRQoL VAS (A) and disease-specific HRQoL CAT (B).
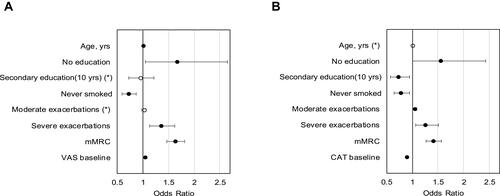
Table 3 Proportion of One-Year Changes in FEV1
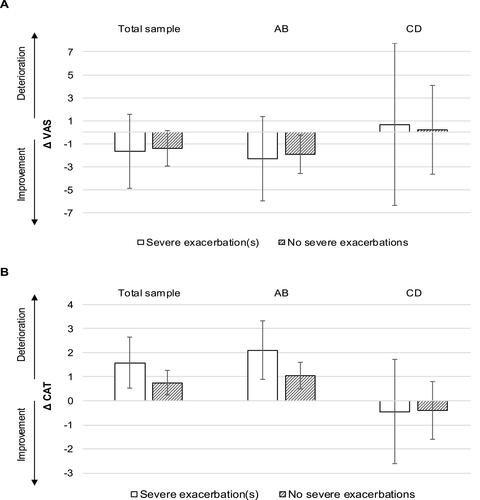
Figure 4 Impact of clinical indicators on HRQoL: Linear relationship between change in FEV1 and VAS (A) and CAT (B).
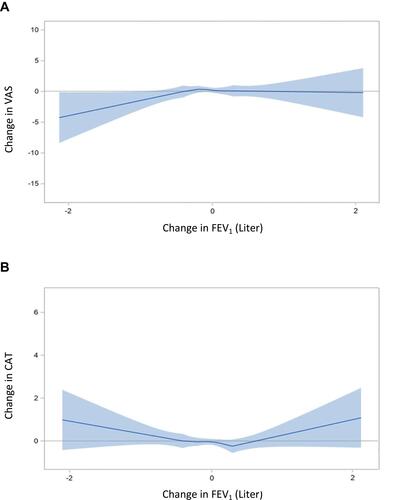
Figure 5 Change score model: impact of FEV1 on HRQoL.
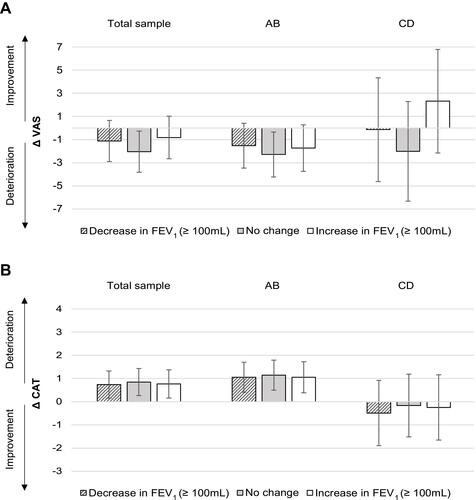
Figure 6 Change score model: impact of exacerbations on HRQoL.