Figures & data
Table 1 Statistical Analysis of Species Richness and Community Diversity
Figure 1 Sequence length distribution before QC processing for each group, the similarity value > 0.97 indicates that all the selected sequences are of high quality. (A) The sequence length of bacteria before QC in BALF. (B) Sequence length after QC of bacteria in BALF. (C) The sequence length before QC of bacteria in atmospheric fine particles. (D) Sequence length of bacteria after QC in atmospheric fine particles.
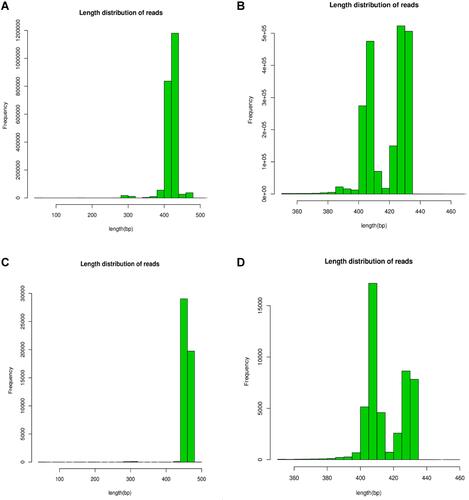
Figure 2 Relationship between OTU number and cluster similarity value.
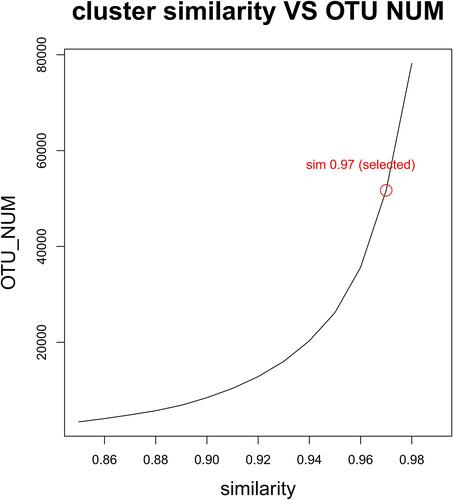
Table 2 Statistical Analysis of Bacterial Taxonomy Annotations in Three Groups
Figure 3 Name and composition ratio of the top 20 bacterial colonies in BALF and PM2.5 samples.
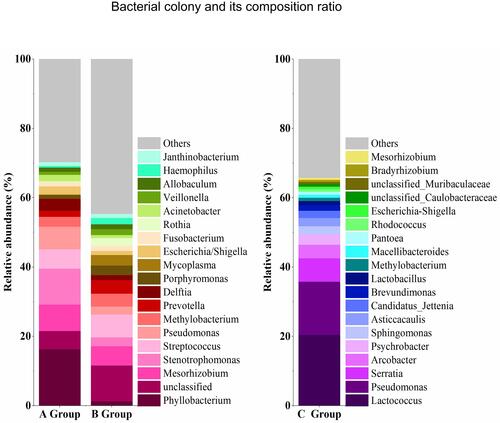
Figure 4 Name and composition ratio of bacterial colonies with abundance greater than 1% in BALF and PM2.5 samples.
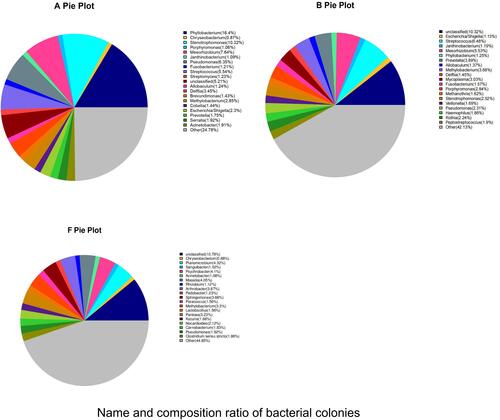
Table 3 Abundance Distribution Characteristics of Pathogenic Bacteria in PM2.5 Carrier Bands in BALF of COPD Patients
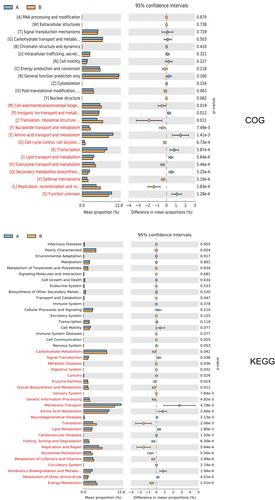
Figure 5 The abundance and difference analysis of bacterial gene functional characteristics are in group A and group B.
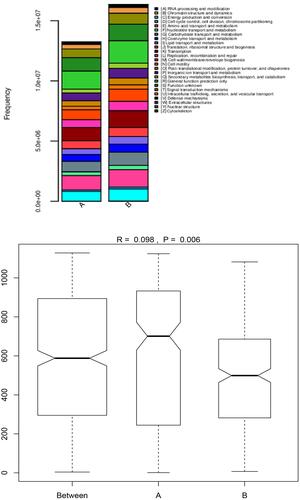
Figure 6 Function category difference graph. The left side of the figure shows the abundance ratio of different functional genes in the two groups of samples, the middle side shows the difference ratio of functional genes in the 95% confidence interval, and the right side shows the P value. Functional genes with P < 0.05 were marked in red, indicating significant differences. Only the 25 functional genes with the lowest P values are listed in the figure.