Figures & data
Table 1 Primers Used for the Real Time-PCR
Figure 1 Chronic CS-induced emphysema and skeletal muscle atrophy in mice. (A) Body weight and gastrocnemius muscle (B) with or without CS exposure in mice. (C) Emphysema and skeletal muscle cross-sectional area (D) with or without CS exposure in mice. Data are representative images (magnification x 200) and expressed as the mean ± SD of each group (n=8) of mice. *p<0.05 vs control group (N).
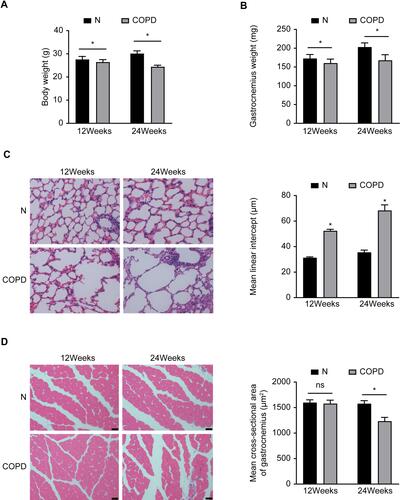
Figure 2 Atrophy and senescence-related protein expression in mice. (A) The atrophy-associated markers protein expression level of MURF1, MAFbx, HDAC2 after 12 and 24 weeks. (B) The senescence markers protein expression level of P53, P21, SMP30 after 12 and 24 weeks. Values are expressed as means±SD. Experiments were repeated 3 times with similar results. *p<0.05 vs control group (N).
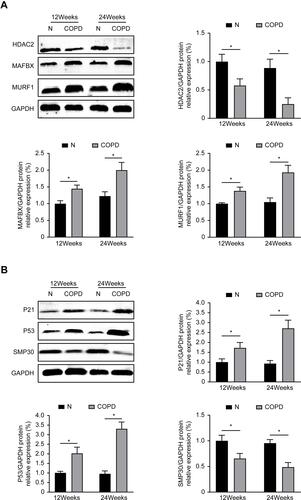
Figure 3 CSE decreases myotube diameter and increases atrophy-related proteins in C2C12 cells. After 6 days of cell differentiation and 24 hours of treatment with CSE, the morphological changes of the cells were observed, and Western analysis of the levels of MAFbx and MuRF1 protein expression was performed. (A) C2C12 myotubular phenotype changes after different CSE concentrations; 200×. (B) Measurements of average myotube diameter after 24 hours in different treatment groups exposed to CSE. (C) The protein expression level of MURF1, MAFbx and HDAC2 after 24 hours in different treatment groups exposed to CSE. Values are expressed as means±SD. Experiments were repeated 3 times with similar results. *p<0.05 vs control group (N).
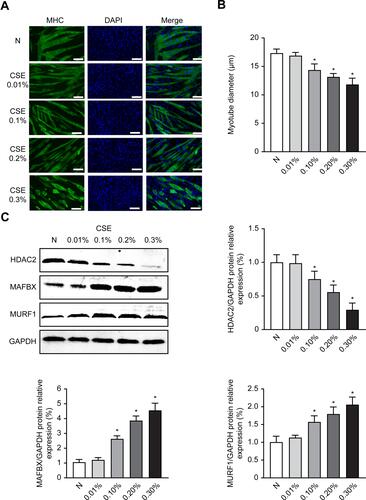
Figure 4 Overexpression of HDAC2 inhibits CSE-induced atrophy in C2C12 cells. (A) Effects of LV-HDAC2 Overexpression on HDAC2 Protein and mRNA. (B) Immunofluorescence measurement of the mean myotube diameter after 24 hours of 0.3% CSE between the different groups; 100×. (C) The protein expression level of MURF1, MAFbx, HDAC2 in cells with or without 0.3% CSE. (D) The mRNA level of MURF1, MAFbx in cells with or without 0.3% CSE. Values are expressed as means±SD. Experiments were repeated 3 times with similar results. *p<0.05 vs control NC group (LV-NC), #p<0.05 vs CSE+LV-NC group.
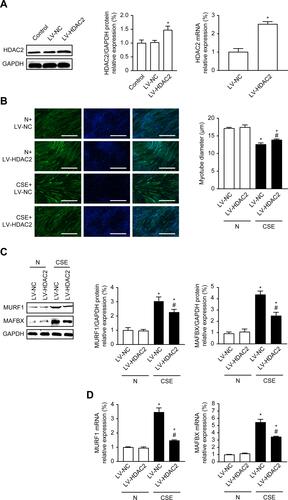
Figure 5 Overexpression of HDAC2 Inhibits Senescence in C2C12 Cells. (A) β-Galactosidase staining measurement of cellular senescence after 24 hours of 0.3% CSE between the different groups, 100×. (B) The protein expression level of P53, P21, SMP30 in cells with or without 0.3% CSE. (C) The mRNA level of P53, P21 in cells with or without 0.3% CSE. (D) The protein expression level of NF-κBp65 and IKK in cells with or without 0.3% CSE. Values are expressed as means±SD. Experiments were repeated 3 times with similar results. *p<0.05 vs control NC group (LV-NC), #p<0.05 vs CSE+LV-NC group.
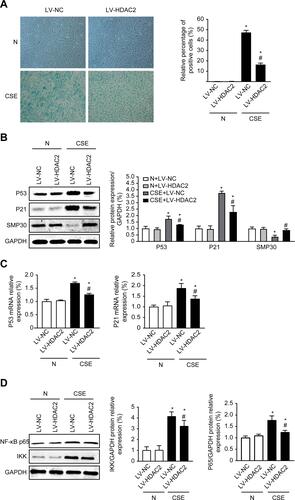
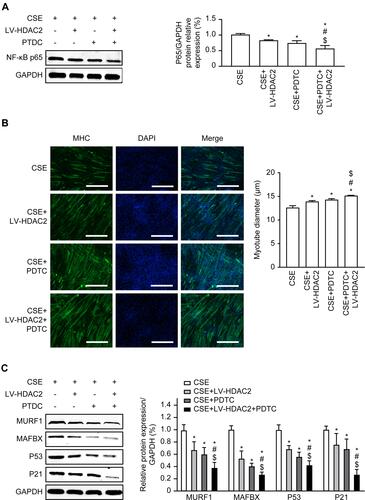
Figure 6 Effects of NF-κB pathway on HDAC2-regulated atrophy and senescence in C2C2 cells. (A) Western blot assays for NF-κBp65 expression after overexpression of HDAC2 and PDTC in CSE. (B) Immunofluorescence detection of myotube diameter, 100×. (C) Western blot assays for MURF1, MAFbx, P53, and P21. Values are expressed as means±SD. Experiments were repeated 3 times with similar results. *p<0.05 vs CSE group, #p<0.05 vs CSE+LV-HDAC2 group, $p<0.05 vs CSE+PDTC group.