Figures & data
Figure 1 Selected metabolism-associated gene signatures. (A) Forest plot of the association between the selected gene and forced expiratory volume in the first second (FEV1). (B) Attribute importance of selected genes related to FEV1 based on Boruta feature selection. (C) Forest plot of the association between the selected gene and FEV1/forced vital capacity (FVC) ratio. (D) Boxplot showing the attribute importance of selected genes related to the FEV1/FVC ratio based on Boruta feature selection.
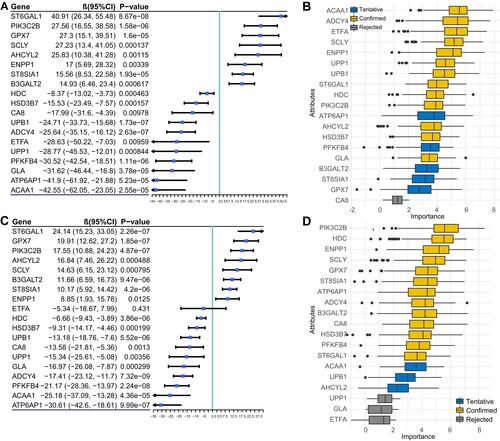
Figure 2 Identification of two metabolism related-subtypes. (A) Principal component analysis displaying the distribution of two subtypes in the ECLIPSE dataset. (B) Multiple density plot showing the distribution of 19 selected genes on two subtypes in the ECLIPSE dataset. (C) Consensus matrix visualizing the stability of the two subtypes in the ECLIPSE dataset. The labels “p1” and “p2” refer to the probability of the sample staying in C1 and C2, respectively. The label “Prob” refers to the probability of the sample staying in the corresponding subgroup. The label “Packs” refers to the pack-years of cigarette smoking. (D) Differences in clinical characteristics between the two subtypes in the ECLIPSE and COPDGene datasets.
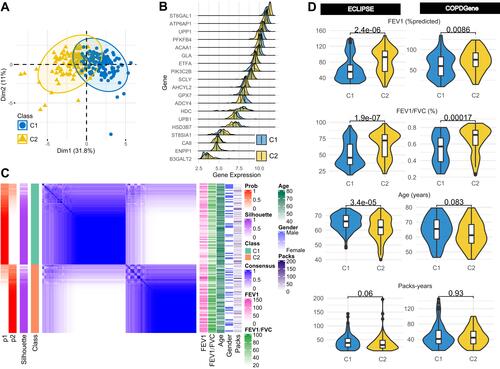
Figure 3 Correlations of the COPD subtypes with the FEV1/FVC-related metabolism pathway. (A) Forest plot showing the association between 17 metabolic pathway single-sample gene set enrichment analysis (ssGSEA) scores and FEV1/FVC in the entire ECLIPSE and COPDGene datasets. (B) Heatmap displaying the differences in 17 metabolic pathway ssGSEA scores in COPD subtypes (C1 vs C2). (C) Venn diagram showing the overlapping results of univariate linear regression (ssGSEA score to FEV1/FVC) and difference analysis (C1 vs C2) in ECLIPSE and COPDGene datasets. (D) Boxplot showing the attribute importance of 16 metabolism pathway ssGSEA scores (except for “arginine biosynthesis”) related to two COPD subtypes in the ECLIPSE and COPDGene cohorts based on the Boruta method.
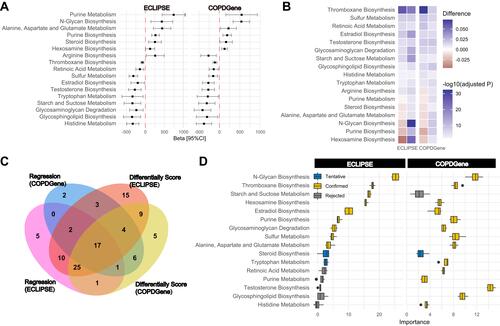
Figure 4 Correlations of the COPD subtypes with immune cell abundance. (A) Heatmap displaying the differences in immune cell abundance between C1 and C2 in the ECLIPSE dataset. C1 and C2 are two molecular subtypes named above. (B) Pearson correlation heatmap matrix between immune cells and metabolic pathways in the ECLIPSE dataset ordered by hierarchical clustering. (C) Heatmap displaying the differences in immune cell abundance between C1 and C2 in the COPDGene dataset. C1 and C2 are two molecular subtypes named above. (D) Pearson correlation heatmap matrix between immune cells and metabolic pathways in the COPDGene datasets ordered by hierarchical clustering.
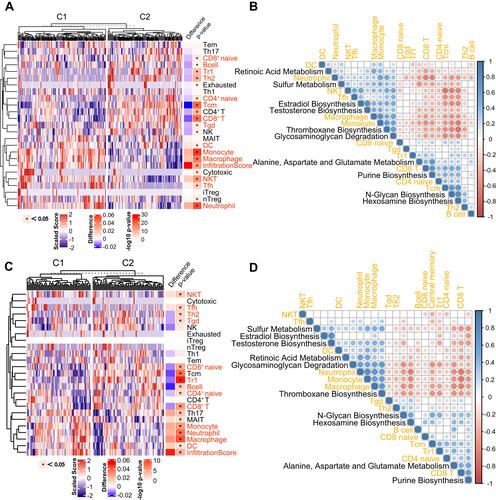
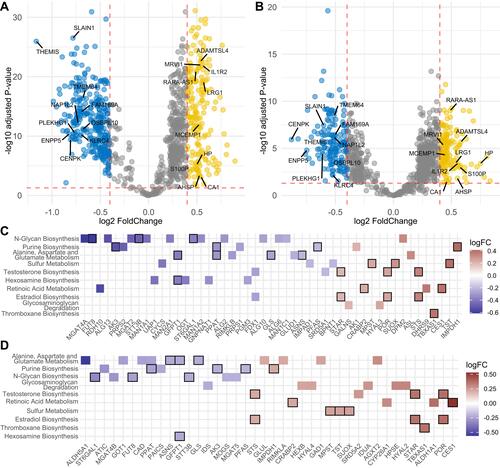
Figure 5 Correlations of the COPD subtypes with transcription features in the ECLIPSE dataset. (A) Volcano plot showing all differentially expressed genes (DEGs) with an RRA score<0.05 between two subtypes in the ECLIPSE dataset. The top 10 upregulated and downregulated genes ranked by RRA score are labelled in the figure. (B) Volcano plot showing all differentially expressed genes with an RRA score<0.05 between the two subtypes in the COPDGene dataset. (C) Heatmap displaying DEGs from 10 metabolic pathways in the ECLIPSE dataset. (D) Heatmap displaying DEGs from 10 metabolic pathways in the COPDGene dataset. The genes with overlapping of two datasets are highlighted by black border.