
Figures & data
Figure 1 Flowchart of selected population in this study.
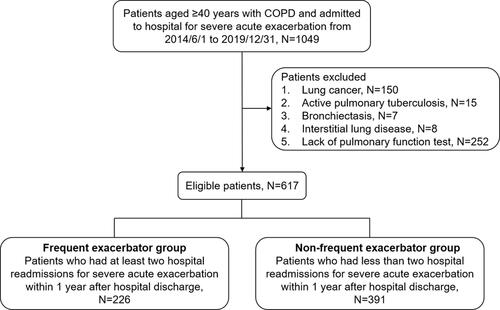
Table 1 Baseline Characteristics and Laboratory Findings on Admission Frequent Exacerbator Group vs Non-Frequent Exacerbator Group
Table 2 Pulmonary Function Test Results and Arterial Blood Gases on Admission (Frequent Exacerbator Group vs Non-Frequent Exacerbator Group)
Table 3 Treatments on Admission and Concurrent Medications (Frequent Exacerbator Group vs Non-Frequent Exacerbator Group)
Figure 2 Kaplan–Meier curves for time to hospital readmissions within 1 year after hospital discharge. (A) Comparison between patients with FEV1 <50% (% of predicted) and FEV1 ≥50% (% of predicted). (B) Comparison between patients with eosinophil count <2% and eosinophil count ≥2%.
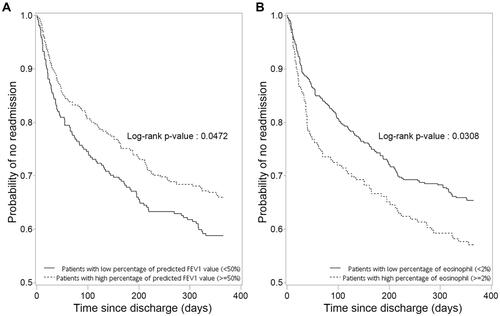
Table 4 Hazard Ratios and Event Rates for COPD-Related Readmission in Different Clinical Characteristic Comparisons