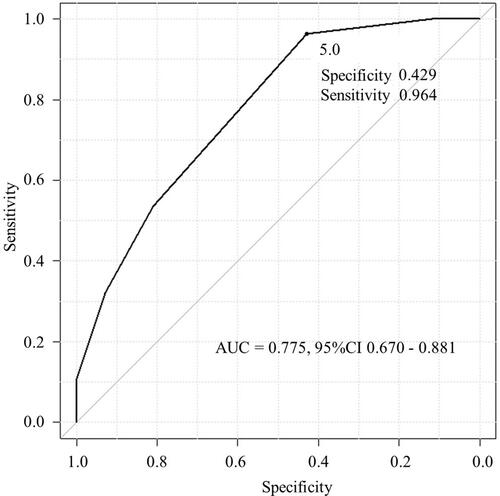
61
Views
0
CrossRef citations to date
0
Altmetric
Corrigendum

Repetitive Saliva Swallowing Test Predicts COPD Exacerbation [Corrigendum]

Page 1285 | Published online: 10 May 2021

Figures & data

Figure 1 Results of an ROC curve analysis using the swallow frequency in RSST. When the RSST cut-off value was set at 5.0, the sensitivity and specificity were 0.964 and 0.429, respectively, and the area under the ROC curve was 0.775.

Figure 1 Results of an ROC curve analysis using the swallow frequency in RSST. When the RSST cut-off value was set at 5.0, the sensitivity and specificity were 0.964 and 0.429, respectively, and the area under the ROC curve was 0.775.