Figures & data
Figure 1 Study design. aConfirmed by spirometry, FEV1/FVC <0.7 (any time). bFuture outcomes ascertained from the database from the defined index date until 90 days post index date for treatment and the day after the defined index date and 12 months post index date, until December 31, 2017, for categorical exacerbations per year and health outcomes of interest.
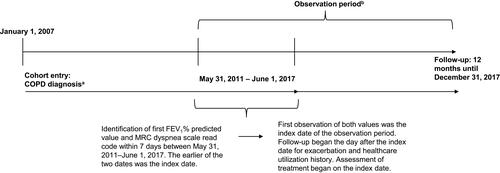
Table 1 Patient Demographics and Clinical Characteristics, Overall and Stratified by GOLD 2017 Group
Table 2 Longitudinal Outcomes and Healthcare Utilization of Patients in the 12 Months After the Index Date, Overall and Stratified by GOLD 2017 Group
Table 3 Time-to-Event Analysis for COPD Exacerbations and Death in the 12 Months After the Index Date According to GOLD 2017 Group
Figure 2 Univariate Cox proportional hazards model for time to the following events according to GOLD classification during the 12 months following the index date, (A) moderate COPD exacerbations; (B) severe COPD exacerbations; (C) death. aPatients were followed up for death from 90 days post index date until 12 months post index date.
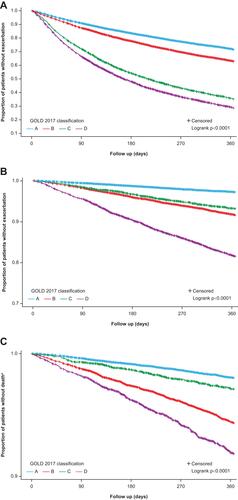
Table 4 Time-to-Event Analysis for COPD Exacerbations and Death in the 12 Months After the Index Date According to MRC Dyspnea Grade
Figure 3 Univariate Cox proportional hazards model for time to the following events according to MRC dyspnea grade during the 12 months following the index date, (A) moderate COPD exacerbations; (B) severe COPD exacerbations; (C) death. aPatients were followed up for death from 90 days post index date until 12 months post index date. Note: P values were generated from a single Log rank test comparing all groups.
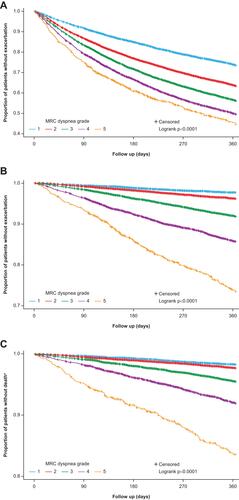
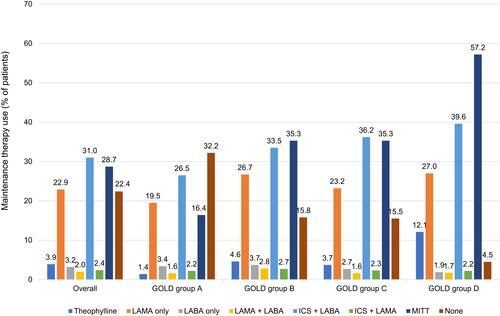
Figure 4 Maintenance therapy use, during the 90 days on or after the index date, overall and stratified by GOLD 2017 group.