
Figures & data
Table 1 Baseline Characteristics of the Groups
Table 2 Association Between Cigarette Smoking-Related Phenotypes and COPD Risk
Table 3 Association Between Allele Frequencies of SNPs and COPD
Table 4 Genotype Frequencies of SNPs in Selected Genetic Models Among Groups
Figure 1 (A) Entropy-based SNP-SNP interaction network of 12 polymorphisms of the genes in case and control subjects. The percent of the entropy for independent factors as well as their interactions are represented in the graph where positive percentage of entropy denotes synergistic interaction while negative percentage denotes redundancy. The best MDR model for gene–gene interaction. Here, the red and orange colors indicate synergistic interaction, gold color denotes the mid-point, green color represents moderate redundancy while blue color denotes the highest. (B) The best model is composed of GSTM1 null deletion, rs1051730, rs16969968, and rs1799895. In each cell, the left bar represents a positive score, and the right bar a negative score. High-risk cells are indicated by gray shading, low-risk cells by light shading, and empty cells by no shading. The patterns of high-risk and low-risk cells differ across each of the different multi-locus dimensions, presenting evidence of epistasis.
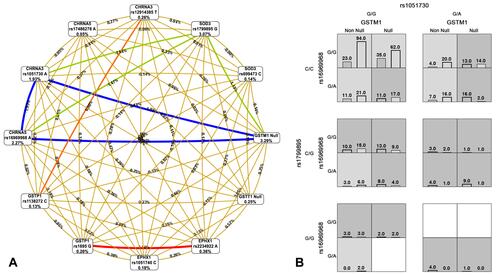
Table 5 Best Models of Gene–Gene Interactions Among the Four COPD Associated Polymorphisms
Table 6 Cumulative Effect of Best Models of Gene–Gene Interactions on COPD
Table 7 Possible Interaction of Smoking-Related Factors with GSTM1, CHRNA3, CHRNA5 and SOD3 Genes Polymorphisms in COPD
Table 8 Cumulative Effect of Four Risk Polymorphisms with Smoking Related Factors on COPD