
Figures & data

Table 1 Socio-Demographic and Clinical Characteristics of Patients
Figure 1 Distribution of patients in ABCD groups using the 2013 (A) and 2017 (B) GOLD edition.
Abbreviations: CAT, COPD Assessment Test; GOLD, Global Initiative for Chronic Obstructive Lung Disease; mMRC, modified Medical Research Council.
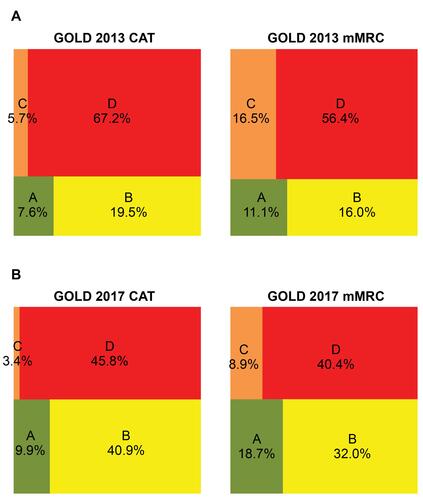
Figure 2 Prevalence of individual respiratory symptoms assessed by questionnaires corresponding for each part of the 24-h day EMSCI, NiSCI and E-RS™:COPD.
Note: Wheezing is not assessed with the derivative instrument of E-RS™:COPD.
Abbreviations: 24-h, 24-hour; EMSCI, Early Morning Symptoms of COPD Instrument; E-RS™:COPD, Evaluating Respiratory Symptoms in COPD; NiSCI, Nighttime Symptoms of COPD Instrument.
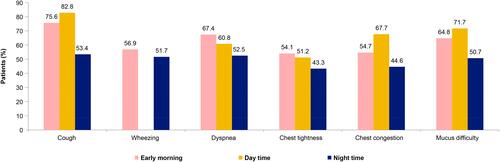
Figure 3 The physical activity level assessed by Investigators (clinical judgment) and self-assessed by patients (EVS questions).
Note: *Expressed in minutes/week of moderate to vigorous exercise.
Abbreviations: EVS, Exercise as Vital Sign; min, minutes.
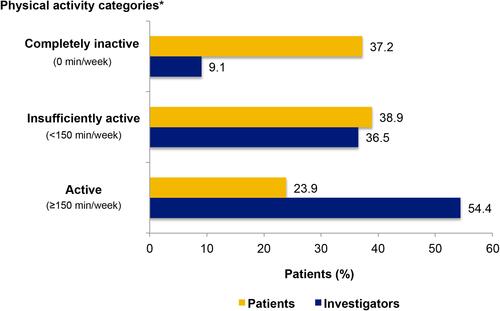
Table 2 Physical Activity Results – YPAS Dimensions
Table 3 Relationship Between 24-h Respiratory Symptoms Severity Score and Patients’ Outcomes
Table 4 Relationship Between Physical Activity and Patients’ Outcomes