Figures & data
Figure 1 Representation of a 3-dimensional lung model. Low attenuation area (LAA) is shown in red. The percentage LAA (LAA%) is calculated as: LAA% = volume of LAA/total lung volume × 100.
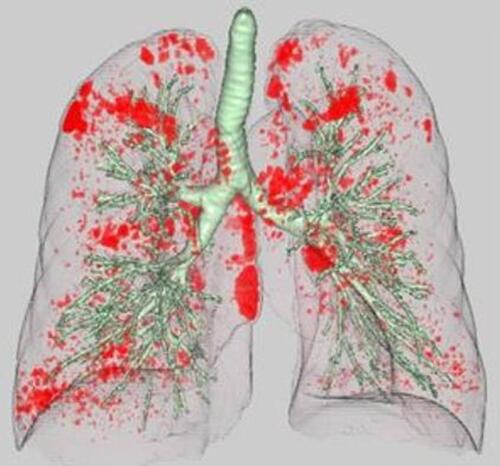
Table 1 Patient Characteristics (n = 343)
Figure 2 Box plot comparing the percentage of low attenuation area (LAA%) between patients with and without postoperative respiratory complications (PRC).
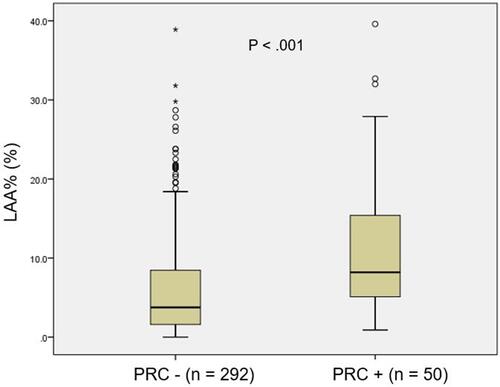
Table 2 Postoperative Respiratory Complications in High and Low LAA% Groups
Table 3 Uni- and Multivariable Analysis of Clinical Factors for Predicting PRC
Figure 3 Scatter plot showing the relationship between FEV1.0% and percentage of low attenuation area (LAA%). The r value indicates the Pearson correlation coefficient.
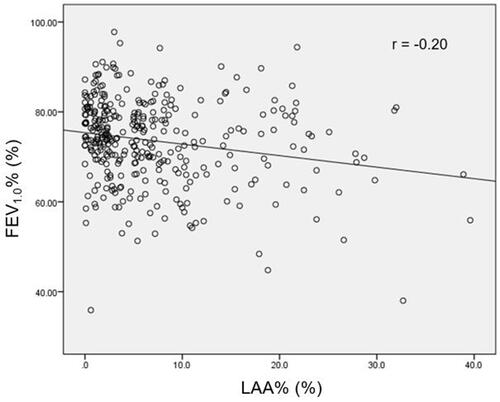
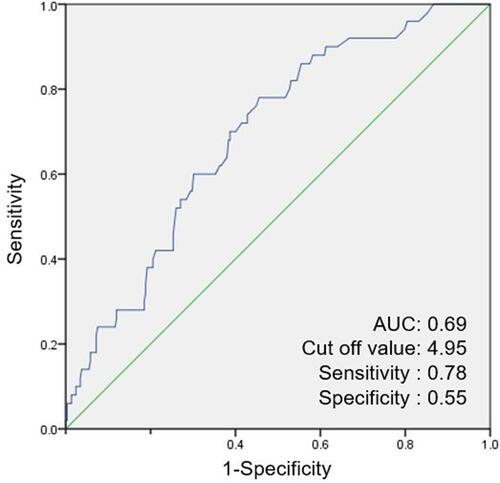
Figure 4 Receiver operating characteristic curve of the low attenuation area (LAA%) for postoperative respiratory complications (PRC).