Figures & data
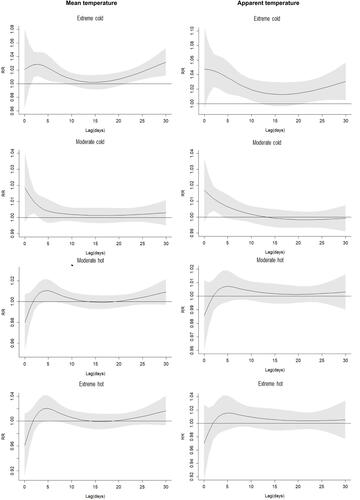
Figure 4 The effect of mean temperature (°C) and apparent temperature on AECOPD hospitalizations along days of lag. The black lines are relative risks and grey regions are 95% confidence intervals.
Notes: The definitions of extreme cold, moderate cold, moderate hot, and extreme hot temperatures are the same as those in the footnotes of Tables 3 and 4.