
Figures & data
Table 1 Selected Baseline Characteristics of the Eligible Cohort
Figure 1 Flowchart of the study cohort assembly.
Abbreviation: COPD, chronic obstructive pulmonary disease.
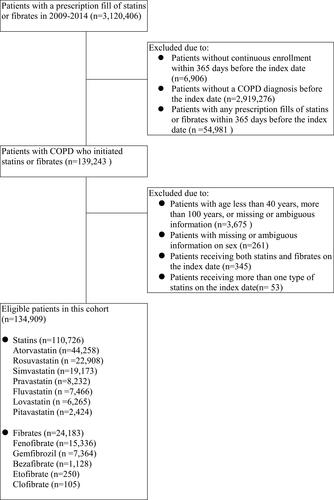
Table 2 Follow-Up, Event Rates, and Risk of COPD Exacerbations Comparing Statins with Fibrates
Figure 2 Kaplan–Meier curves for the probability of free of COPD exacerbations within 180 days after the index date (A) Kaplan–Meier curves before matching. (B) Kaplan–Meier curves after hd-PS matchinga. aData were weighted by matching ratio in the hd-PS matching analysis.
Abbreviations: COPD, chronic obstructive pulmonary disease; hd-PS, high-dimensional propensity score.
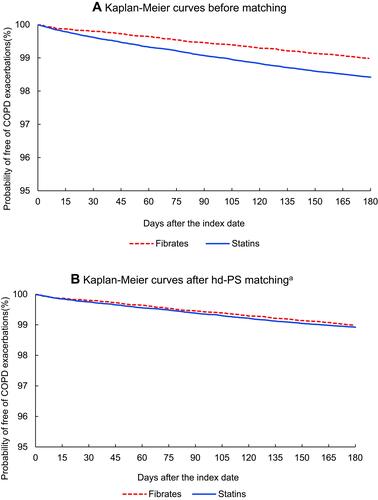
Table 3 Risk of COPD Exacerbations Comparing Statins with Fibrates, by Maximum Follow-Up Duration and Follow-Up Scheme
Table 4 Risk of COPD Exacerbations Comparing Statins with Fibrates, by Type of Statins and Patient Characteristic