Figures & data
Figure 1 NOD1 was up-regulated in the lungs of mice exposed to cigarette smoke (CS). RT-qPCR and Western blotting were used to analyze the mRNA (A) and proteins expressions (B and C) of NOD1 in the lung tissues between the controls and CS exposed mice. Data shown are mean ± SD. n = 3 for each group. **p < 0.01 and ***p < 0.001 between the indicated groups. Unpaired t-test.
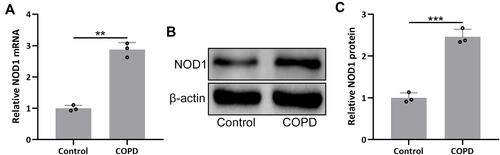
Figure 2 iE stimulated NOD1 in the lung tissues. Animals received i.p. 50, 150, 200 μg of iE/day, or vehicle. After 2 weeks of treatment, RT-qPCR and Western blotting were used to analyze the mRNA (A) and proteins expressions (B) of NOD1 in mouse lung tissues. Data shown are mean ± SD. n = 3 from 6 mixed tissues for each group. *p < 0.05, **p < 0.01, ***p < 0.001 and ns means no significance between the indicated groups. One-way ANOVA followed Dunn’s multiple comparisons test.
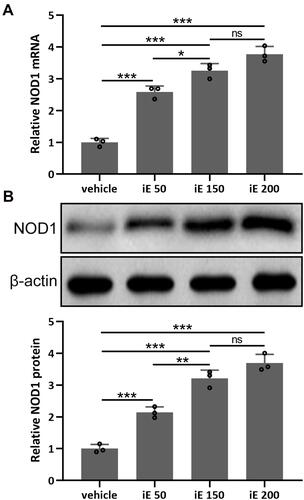
Figure 3 NOD1 activation exaggerated CS-induced lung function impairment. Lung function parameters including total lung capacity (A), FEV20/FVC (B), airway resistance (C) and functional residual capacity (D) among different groups were calculated three months after CS inhalation. Data shown are mean ± SD. n = 10 for each group. *p < 0.05, **p < 0.01, ***p < 0.001 and ns means no significance between the indicated groups. One-way ANOVA followed Dunn’s multiple comparisons test.
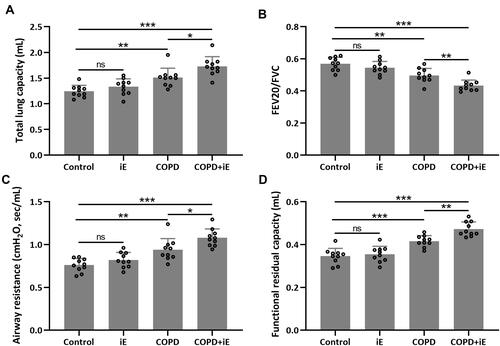
Figure 4 NOD1 activation exaggerated CS-induced pulmonary histological damage. Three months after CS inhalation, lung pathology was determined by H&E staining. The representative images are shown in (A). Comparisons of inflammatory score (B), average alveolar intercept (C) and airway wall thickness (D). Data shown are mean ± SD. n = 6 for each group. *p < 0.05, **p < 0.01, ***p < 0.001 and ns means no significance between the indicated groups. One-way ANOVA followed Dunn’s multiple comparisons test.
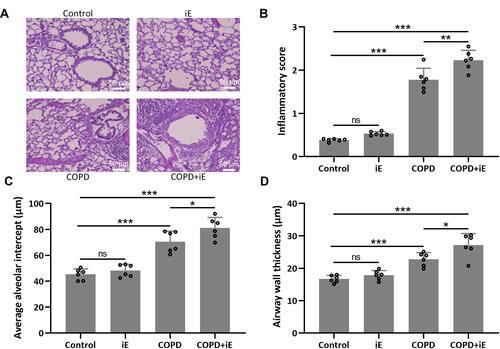
Figure 5 NOD1 activation exaggerated CS-induced inflammation cells in BALF. Three months after CS inhalation. Counts of total cells (A), macrophages (B), neutrophils (C) and lymphocytes (D) in BALF were compared. Data shown are mean ± SD. n = 10 for each group. *p < 0.05, **p < 0.01, ***p < 0.001. One-way ANOVA followed Dunn’s multiple comparisons test.
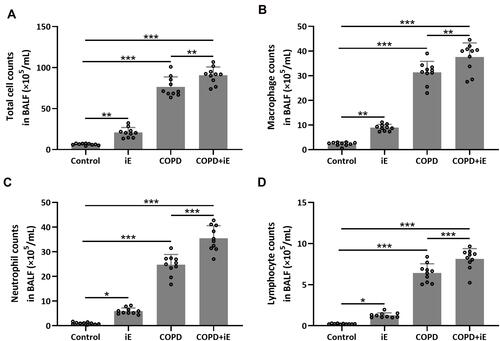
Figure 6 NOD1 activation exaggerated CS-induced pulmonary inflammatory responses. Three months after CS inhalation, pulmonary Ccl-2 (A), Cxcl-10 (B), IL-1β (C) and IFN-γ (D) were measured by ELISA. Data shown are mean ± SD. n = 10 for each group. *p < 0.05, **p < 0.01, ***p < 0.001. One-way ANOVA followed Dunn’s multiple comparisons test.
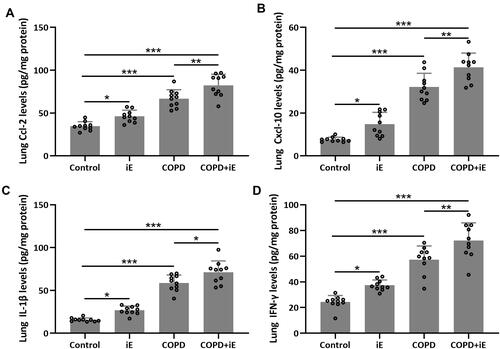
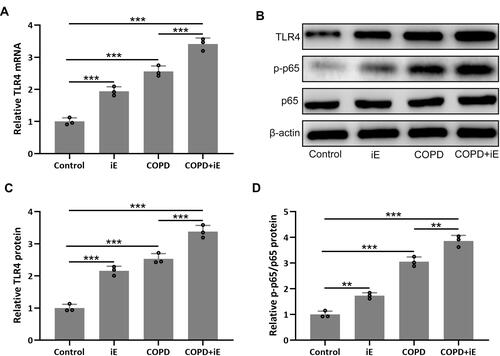
Figure 7 NOD1 exaggerated CS-induced pulmonary TLR4/NF-κB signaling activation. Three months after CS inhalation, pulmonary mRNA expression of TLR4 (A) were measured by RT-qPCR. Pulmonary protein expressions of TLR4, p-p65 and p65 (B) were measured by Western blotting. The expressions were normalized to control (C and D). Data shown are mean ± SD. n = 3 for each group. **p < 0.01, ***p < 0.001. One-way ANOVA followed Dunn’s multiple comparisons test.