142
Views
2
CrossRef citations to date
0
Altmetric
Research Letter

Characterizing Gas Exchange Physiology in Healthy Young Electronic-Cigarette Users with Hyperpolarized 129Xe MRI: A Pilot Study

, , ORCID Icon, , , , , , , , , , , , , , & show all
Pages 3183-3187 | Published online: 23 Nov 2021

Figures & data

Figure 1 Representative ventilation and gas-exchange MRI with quantitative maps for a healthy control (FEV1% =103%, FVC%=109%) and an asymptomatic e-cigarette user (FEV1% =104%, FVC%=106%, %DLCO=103%). The first row shows ventilation scans (brighter appearance represents better-ventilated areas). For the quantitative ventilation maps (second row) of the young, healthy control vs the e-cigarette subject, VDP (areas without any ventilation) was 1% vs 1%. The third through fifth rows show the three gas-exchange ratios: Tissue-to-Gas (T/G, third row), RBC-to-Gas (R/G, fourth row), and RBC-to-Tissue (R/T, fifth row) ratios, where red indicates low gas exchange and yellow indicates high gas exchange. For the quantitative gas exchange maps of the young, healthy control vs the e-cigarette subject, T/G ratio was 1.11% vs 0.84%, R/G ratio 0.36% vs 0.34%, and R/T ratio 0.32 vs 0.41.

Figure 1 Representative ventilation and gas-exchange MRI with quantitative maps for a healthy control (FEV1% =103%, FVC%=109%) and an asymptomatic e-cigarette user (FEV1% =104%, FVC%=106%, %DLCO=103%). The first row shows ventilation scans (brighter appearance represents better-ventilated areas). For the quantitative ventilation maps (second row) of the young, healthy control vs the e-cigarette subject, VDP (areas without any ventilation) was 1% vs 1%. The third through fifth rows show the three gas-exchange ratios: Tissue-to-Gas (T/G, third row), RBC-to-Gas (R/G, fourth row), and RBC-to-Tissue (R/T, fifth row) ratios, where red indicates low gas exchange and yellow indicates high gas exchange. For the quantitative gas exchange maps of the young, healthy control vs the e-cigarette subject, T/G ratio was 1.11% vs 0.84%, R/G ratio 0.36% vs 0.34%, and R/T ratio 0.32 vs 0.41.

Figure 2 (AD) Comparison of quantitative ventilation and gas-exchange MRI results between young e-cigarette subjects (n=5) and age-matched healthy controls (n=10). Compared to healthy controls, e-cigarette subjects demonstrated significantly decreased Tissue-to-Gas ratio (p=0.04) and significantly elevated RBC-to-Tissue ratio (p=0.0007). P values were generated by the Mann–Whitney t-test.

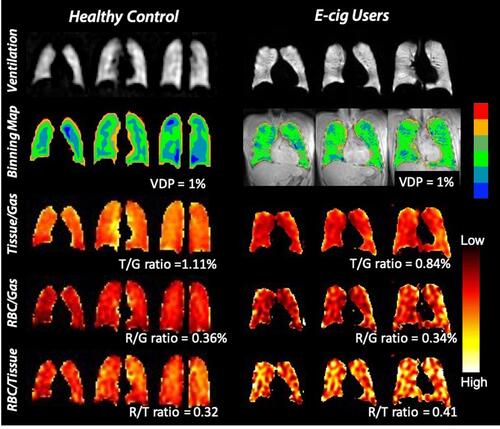
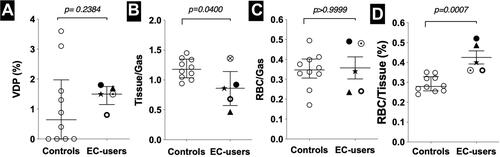
Figure 2 (A–D) Comparison of quantitative ventilation and gas-exchange MRI results between young e-cigarette subjects (n=5) and age-matched healthy controls (n=10). Compared to healthy controls, e-cigarette subjects demonstrated significantly decreased Tissue-to-Gas ratio (p=0.04) and significantly elevated RBC-to-Tissue ratio (p=0.0007). P values were generated by the Mann–Whitney t-test.