
Figures & data
Figure 1 Flow chart of the study participants.
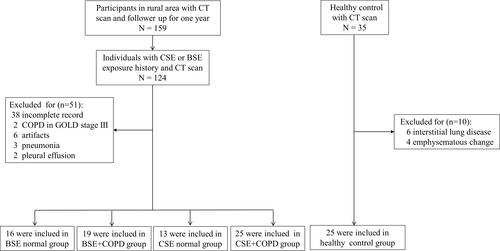
Figure 2 Sample computed tomography (CT) scans used to determine pulmonary small vessels. (A) CT image in middle slice of lung. (B) Segmented lungs shaded in grey. (C) Pulmonary vessels shaded in green. (D) Pulmonary small vessels shaded in red.
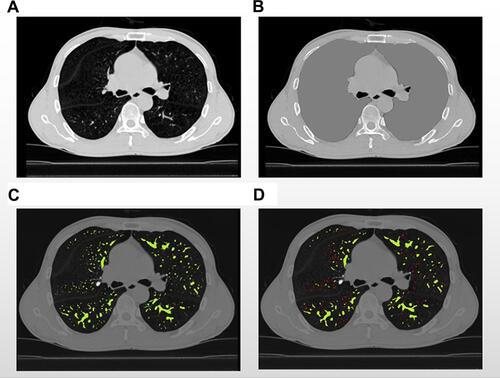
Figure 3 Sample computed tomography (CT) scans used to determine pectoralis muscle, erector spinae muscle. (A) Pectoralis major muscle shaded in red, pectoralis minor muscle shaded in brown. (B) Erector spinae muscle shaded in red.
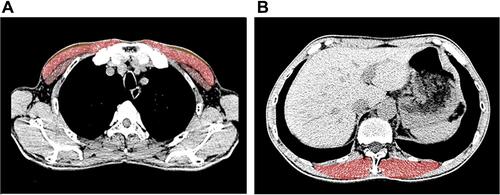
Table 1 Baseline Characteristics Among BSE, CSE Groups and Healthy Control Groups
Table 2 Comparison of CT Characteristics on Emphysema, Pulmonary Small Vessel and Airway Remodeling Among BSE, CSE Groups and Healthy Groups
Table 3 Comparison of CT Characteristics on Pectoralis Muscle and Erector Spinae Muscle Among BSE, CSE Groups and Healthy Groups