Figures & data
Table 1 Main Characteristics of Patients with COPD Included in the Study
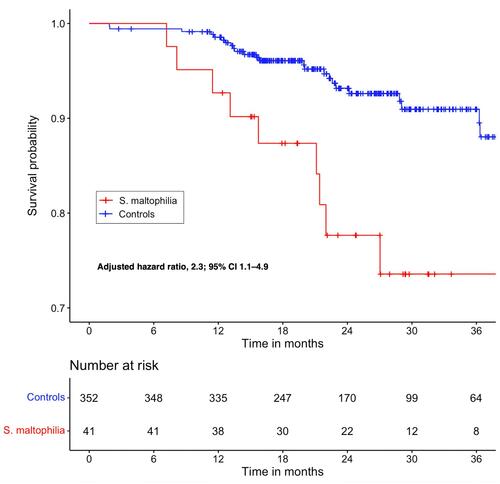
Figure 1 Focused principal component analysis (FPCA) for the association between presence of S. maltophilia and several host factors. FPCA is a simple graphical display of correlation structures focusing on a particular dependent variable. The display reflects primarily the correlations between the dependent variable and all other variables (covariates) and secondarily, the correlations among the covariates. The dependent variable (the presence of S. maltophilia in the sputum) is at the center of the diagram, and the distance from this point to a covariate faithfully represents their pairwise Spearman correlation coefficient (using ranked values of continuous variables). Green covariates are positively correlated and yellow covariates negatively correlated with the dependent variable. Covariates (in bold) inside the red circle are significantly correlated with the dependent variable (with a p value < 0.05). The diagram also shows relationships between covariates as follows: correlated covariates are close (for positive correlations, allowing identification of clusters) or diametrically opposite vis‐a‐vis the origin (for negative correlations), whereas independent covariates make a right angle with the origin.
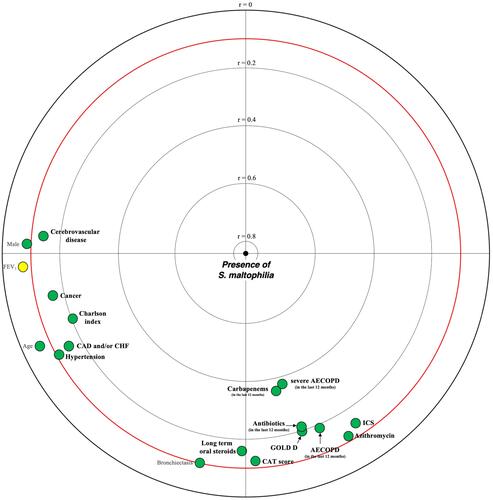
Figure 2 Kaplan–Meier survival curves over the first 36 months following sputum detection of S. maltophilia. Survival data was censored at 36 months. Mortality was adjusted for age, Charlson comorbidity index and FEV1.