
Figures & data
Figure 1 Flow chart of obtaining the study population.
Abbreviations: ACURE, acute exacerbation of chronic obstructive pulmonary disease inpatient registry; AECOPD, acute exacerbation of chronic obstructive pulmonary disease; PHD, pulmonary heart disease.
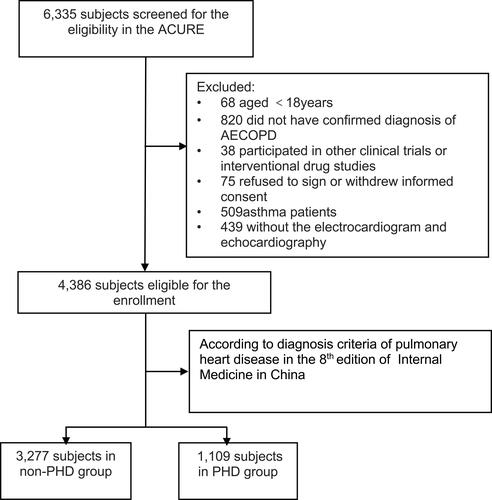
Table 1 The Demographics, Smoking Status and Comorbidity of Study Population
Table 2 The Clinical Features of AECOPD Patients
Table 3 The Clinical Outcomes of Study Population
Table 4 Multivariate Adjusted Relative Risk for Total Cost and Drug Cost in Study Population
Table 5 Multivariate Adjusted Relative Risk for Length of Stay in Study Population