
Figures & data
Figure 1 Study flow diagram.
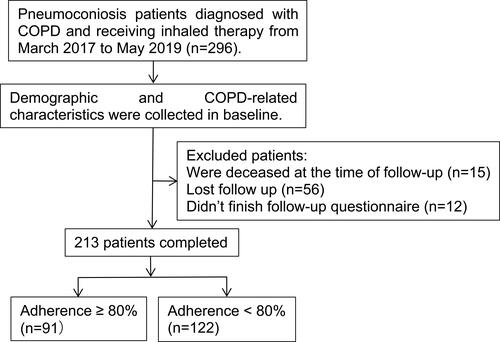
Table 1 Demographic, Clinical, and Functional Characteristics of Pneumoconiosis with COPD
Table 2 Correlations Between Symptoms (CAT and mMRC Grade), Lung Function, Exacerbation Frequency in the Last Year, and Dust Exposure Duration in Baseline (n = 296)
Table 3 Socio-Demographic and Clinical Characteristics of Adherent and Non-Adherent
Table 4 Multivariable Regression Analysis for Non-Adherent of Inhaled Therapy in Pneumoconiosis with COPD