
Figures & data
Figure 1 Study flow chart.
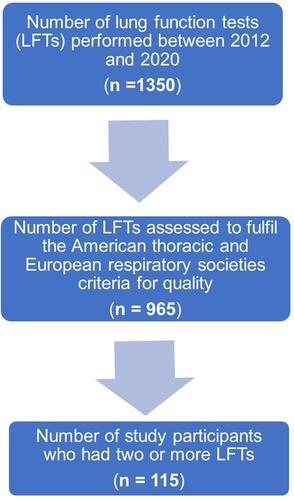
Table 1 Clinical Characteristics of Patients with Multiple Lung Function Tests (LFTs) Recorded (n = 115)
Table 2 Lung Function Parameters (LFPs) at First and Final Lung Function Test (LFT) (n = 115)
Table 3 Rate of Change in Lung Function Parameters (LFPs) Values (Ml/Year or %/Year for Predicted Values) Stratified by Radiological Evidence for Chronic Airway Disease
Table 4 Rate of Change in Lung Function Parameters Values (Ml/Year for Predicted Values) Between Levels of Smoking Recorded (Note Smoking Status Adjudged as the Highest Smoking Level Reported Through the Study Period)
Table 5 Rate of Change in Lung Function Parameters Values (ml/Year for Predicted Values) Between Inhaled Pharmacotherapy Use (Note Pharmacotherapy Level Adjudged from What Was Reported at the Final Lung Function Test)
Table 6 Clinical Characteristics of Patients with Multiple Lung Function Tests (LFTs) Recorded Stratified by Level of Pharmacotherapy Reported
Figure 2 Coefficient plot showing univariate linear regression effects (Beta [95% confidence interval]) for normally distributed and quantile linear regression effects (Beta [95% confidence interval]) for non-parametrically distributed clinical characteristics by reported levels of pharmacotherapy usage against no pharmacotherapy.
![Figure 2 Coefficient plot showing univariate linear regression effects (Beta [95% confidence interval]) for normally distributed and quantile linear regression effects (Beta [95% confidence interval]) for non-parametrically distributed clinical characteristics by reported levels of pharmacotherapy usage against no pharmacotherapy.](/cms/asset/eb39d485-ddea-4f77-bc62-c01e6d3c22c5/dcop_a_12163972_f0002_c.jpg)
Figure 3 Coefficient plot showing univariate logistic regression effects (Odds ratio [95% confidence interval]) by reported levels of pharmacotherapy usage against no pharmacotherapy. Note that non-smoker and combined chronic obstructive pulmonary disease (COPD) + bronchiectasis are omitted due to low numbers.
![Figure 3 Coefficient plot showing univariate logistic regression effects (Odds ratio [95% confidence interval]) by reported levels of pharmacotherapy usage against no pharmacotherapy. Note that non-smoker and combined chronic obstructive pulmonary disease (COPD) + bronchiectasis are omitted due to low numbers.](/cms/asset/2916285b-4fb1-4953-b9c7-84295e316192/dcop_a_12163972_f0003_c.jpg)