
Figures & data
Table 1 Evolution of Inflammatory Profile at Baseline, After Three and Nine Years
Figure 1 IL-6 distribution of the population studied at baseline.
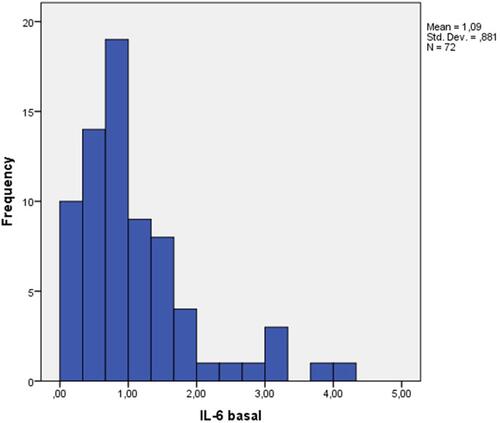
Figure 2 Kaplan–Meier mortality curve in relation to patients with IL-6 ≥ or < 3.1pg/mL.
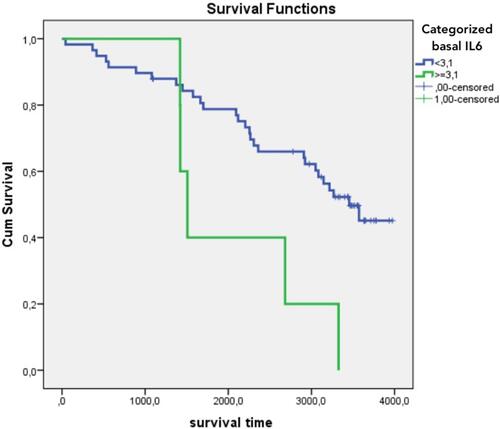
Figure 3 Kaplan–Meier mortality curve in relation to patients with IL-6 ≥ or < 2.3pg/m.
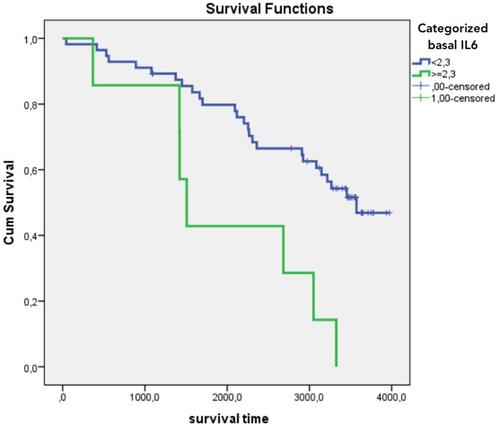
Table 2 Assessment of IL-6 as a Time Dependent Covariate in Cox Regression Analysis