Figures & data
Figure 1 Flow diagram of subject recruitment and data availability.
Abbreviations: N, number; OSAS, obstructive sleep apnea syndrome; OHS, obesity hypoventilation syndrome; NMD, neuromuscular diseases; SRI, Severe Respiratory Insufficiency Questionnaire.
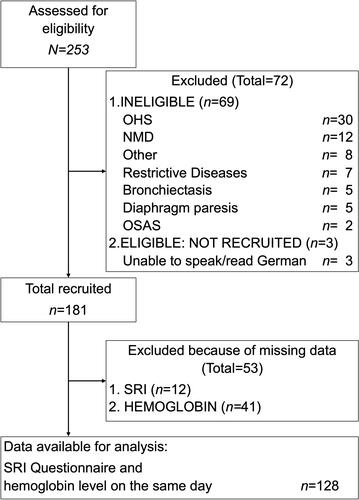
Table 1 Patient Characteristics, Exacerbation History, Hemoglobin Levels, Number of Anemic Patients, and SRI Scores (n=128, if Not Otherwise Stated)
Table 2 Multiple Linear Regression Analysis, with the SRI Summary Scale Score as the Dependent Variable (N=128)
Figure 2 Regression coefficients for anemia and exacerbation history in relation to SRI scores.
Notes: Colored bars (grey for anemia, black for exacerbation history) indicate statistical significance (P <0.05); white bars indicate non-significance (P >0.05).
Abbreviations: SRI, Severe Respiratory Insufficiency Questionnaire; SS, Summary Scale; RC, Respiratory Complaints; PF, Physical Functioning; AS, Attendant Symptoms and Sleep; SR, Social Relationships; AX, Anxiety; WB, Psychological Well-Being; SF, Social functioning.
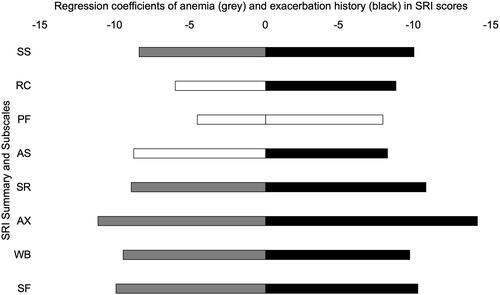
Figure 3 95% confidence intervals for the regression coefficient of SRI scores used in the multiple linear regression analysis for exacerbation history.
Notes: Black bars (exacerbation history) indicate statistical significance (P <0.05); white bars indicate non-significance (P >0.05); vertical line within each bar represents the regression coefficient.
Abbreviations: SRI, Severe Respiratory Insufficiency Questionnaire; SS, Summary Scale; RC, Respiratory Complaints; PF, Physical Functioning; AS, Attendant Symptoms and Sleep; SR, Social Relationships; AX, Anxiety; WB, Psychological Well-Being; SF, Social functioning.
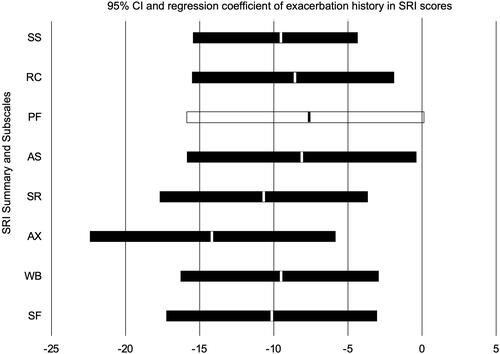
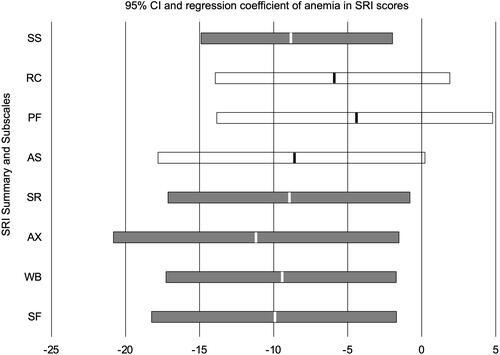
Figure 4 95% confidence intervals for the regression coefficient of SRI scores used in multiple linear regression analysis for anemia.
Notes: Grey bars (anemia) indicate statistical significance (P <0.05); white bars indicate non-significance (P >0.05); vertical line within each bar represents the regression coefficient.
Abbreviations: SRI, Severe Respiratory Insufficiency Questionnaire; SS, Summary Scale; RC, Respiratory Complaints; PF, Physical Functioning; AS, Attendant Symptoms and Sleep; SR, Social Relationships; AX, Anxiety; WB, Psychological Well-Being; SF, Social functioning.