Figures & data
Table 1 Patient Demographics
Figure 1 Micrographs of ACE2, Furin and TMPRSS2 protein expression in the small airways of smokers and COPD patients. The top inset images depict small airway epithelium taken at x40 magnification. The bottom inset images depict the parenchymal alveoli at x20 magnification.
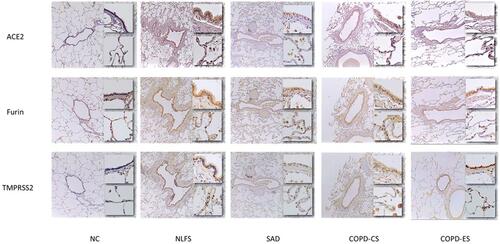
Figure 2 Comparison of total type 2 pneumocytes and alveolar macrophages in normal controls, normal lung function smokers, SAD, and COPD patients with normal controls. An increase in (A) the total number of type 2 pneumocytes per parenchymal area and (B) the total number of alveolar macrophages per parenchymal area in NLFS, SAD, COPD-CS, and COPD-ES compared to NC. Significance is indicated as: *p <0.05, **p< 0.01, ***p<0.001 and ****p<0.0001, the one-way ANOVA test was used for statistical analysis.
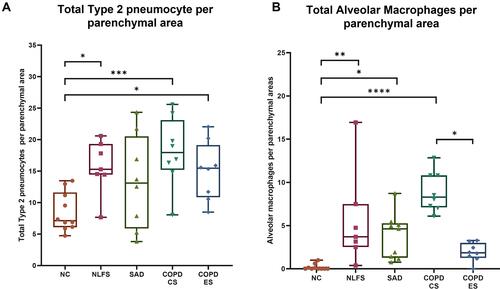
Figure 3 Percent small airway (SA) epithelial expression of ACE2, Furin and TMPRSS2 in normal controls, normal lung function smokers, SAD, and COPD patients. An increase in ACE2, Furin and TMPRSS2 expression was observed in all pathological groups NLFS, SAD, COPD-CS, and COPD-ES compared to NC for (A) ACE2, (B) Furin, and (C) TMPRSS2. Significance is indicated as: *p <0.05, **p< 0.01, ***p<0.001 and ****p<0.0001, the one-way ANOVA test was used for statistical analysis.
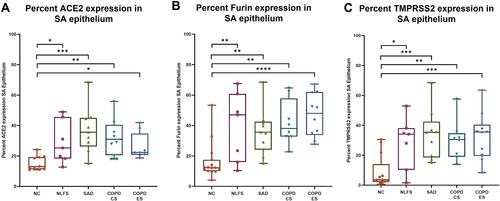
Figure 4 Differences in ACE2, Furin and TMPRSS2 positive and negative type 2 pneumocytes (T2P) in normal controls, normal lung function smokers, SAD, and COPD patients. (A) Differential inter and intragroup analysis of protein expression in type 2 pneumocytes as fold change for positive cells over negative cells in NC, NLFS, SAD, COPD-CS and COPD-ES for (A) ACE2, (B) Furin, and (C) TMPRSS2. Significance is indicated between intergroup *p <0.05, **p< 0.01, ***p<0.001 and intragroup ##p< 0.01, ###p<0.001 and ####p<0.0001 variability, the two-way ANOVA test was used for statistical analysis.
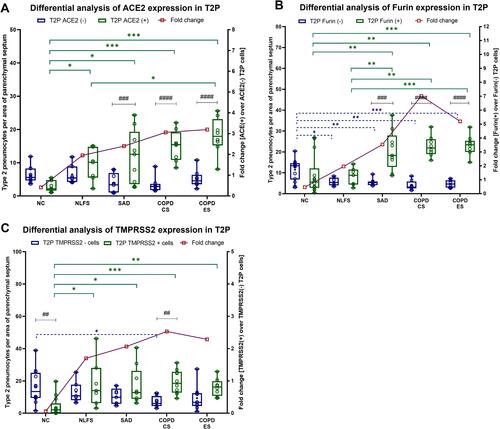
Figure 5 Differences in ACE2, Furin and TMPRSS2 positive and negative alveolar macrophages (AMs) in normal controls, normal lung function smokers, SAD, and COPD patients. (A) Differential inter and intra group analysis of protein expression in alveolar macrophages as fold change for positive cells over negative cells in NC, NLFS, SAD, COPD-CS and COPD-ES for (A) ACE2, (B) Furin, and (C) TMPRSS2. Significance is indicated as: *p <0.05, **p< 0.01, ***p<0.001 and ****p<0.0001 and intragroup #p <0.05, ##p< 0.01 and ###p<0.001 variability, the two-way ANOVA test was used for statistical analysis.
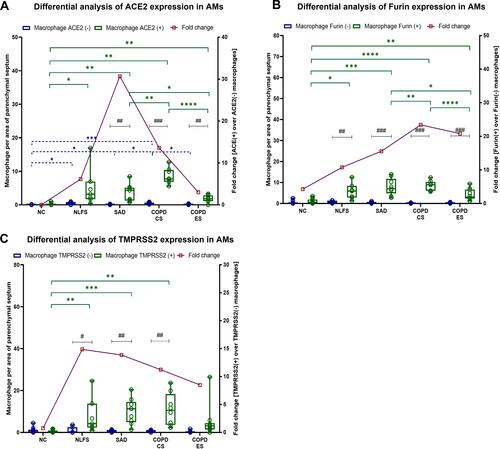
Figure 6 Correlation coefficient analysis for ACE2, Furin and TMPRSS2 in small airway epithelium, type 2 pneumocytes (T2P) and alveolar macrophages (AMs). Pearson r’ correlation analysis was performed to estimate the degree of co-expression of ACE2, Furin and TMPRSS2 in NLFS, SAD, COPD-CS and COPD-ES compared to NC in (A) small airway epithelium, (B) type 2 pneumocytes, and (C) alveolar macrophages. Significance is indicated as **p< 0.01 and ***p<0.001.
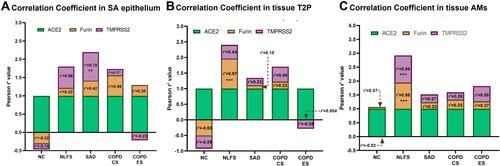
Table 2 Correlations of ACE2, Furin and TMPRSS2 with Physiological Lung Parameters
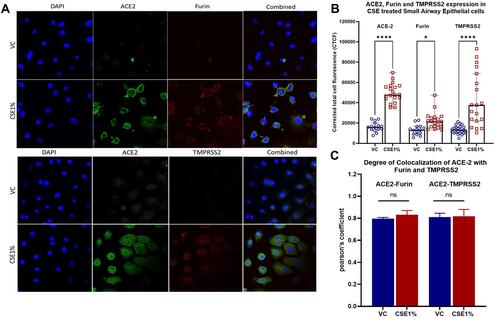
Figure 7 Immunofluorescence of proteins (ACE2, Furin, and TMPRSS2) associated with SARS-CoV-2 adhesion and infection. ACE2, Furin and TMPRSS2 protein expression of small airway epithelial cells following cigarette smoke exposure. Small airway epithelial cells were exposed to 1% cigarette smoke extract (CSE) or appropriate vehicle control (VC) (1% DMSO) and incubated for 24 hours. (A) Protein expression of ACE2 (green), Furin (red, top) and TMPRSS2 (red, bottom) with DAPI (blue) was assessed through immunofluorescence staining and confocal imaging. Images at 40×. (B) Cigarette smoke extract-treated cells had significantly greater corrected total cell fluorescence of ACE-2, Furin, and TMPRSS2. (C) Co-localisation does not vary between cigarette smoke extract-treated cells and vehicle controls (VC). Corrected total cell fluorescence and Pearson’s coefficient were calculated using ImageJ. Results are represented as medians ± range. Ns= non-significant; *p<0.05; ****p<0.0001.