Figures & data
Figure 1 Infographic summary of the study background and base case results.
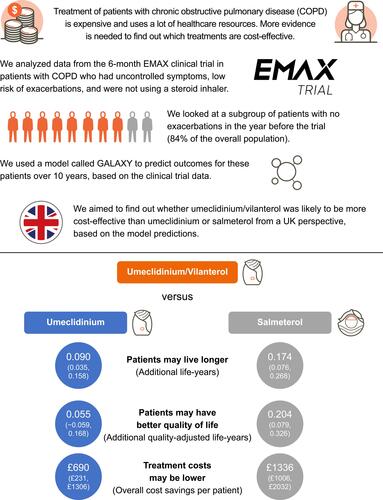
Table 1 Model Inputs
Table 2 Cumulative and Incremental Predicted Outcomes for UMEC/VI versus UMEC and SAL Over a 10-Year Horizon
Table 3 Scenario and Sensitivity Analyses
Figure 2 Probabilistic sensitivity analysis of incremental cost-effectiveness with (A) UMEC/VI versus UMEC and (B) UMEC/VI versus SAL, showing incremental differences between costs and QALYs between treatments over 5000 Monte Carlo simulations where distributions of input parameters were assigned and sampled randomly. Red circles indicate the base case results.
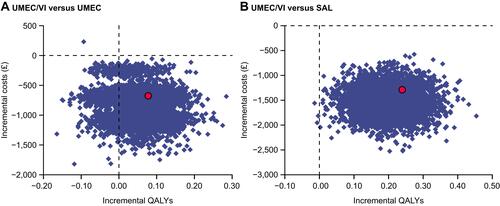
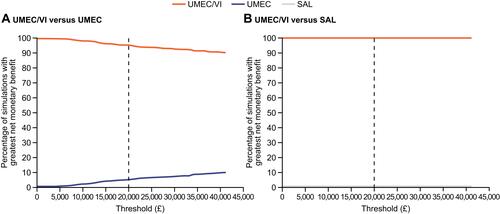
Figure 3 Net benefit acceptability curves for with (A) UMEC/VI versus UMEC and (B) UMEC/VI versus SAL, showing the relative probability of cost-effectiveness across the range of £0–45,000 per QALY for competing treatments included in the model. The dashed vertical line indicates the willingness-to-pay threshold at £20,000.