Figures & data
Table 1 Baseline Patient Characteristics
Table 2 Spirometry Results
Figure 1 Density (frequency) distribution of FEV1 by smoking status (A), degree of indoor woodfire exposure (B), BMI (C) and betel nut use (D).
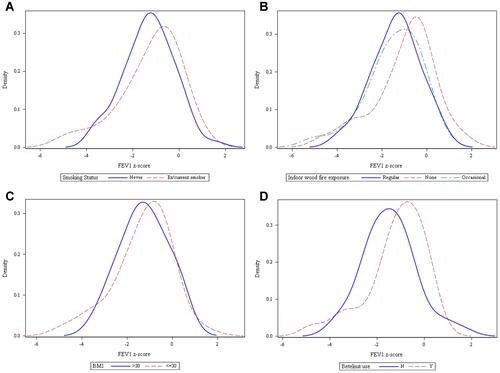
Figure 2 Density (frequency) distribution of FVC by smoking status (A), degree of indoor woodfire exposure (B), BMI (C) and betel nut use (D).
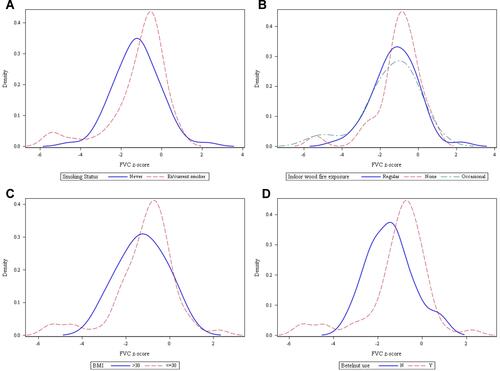
Figure 3 Density (frequency) distribution of FEV1/FVC by smoking status (A), degree of indoor woodfire exposure (B), BMI (C) and betel nut use (D).
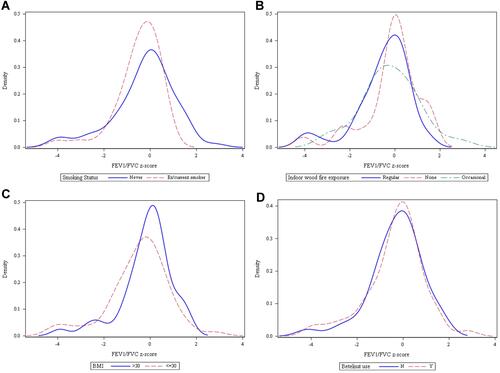
Table 3 Emergency Patient Demographics
Figure 4 Adult patients seen in emergency by presentation (%). Note some adult patients had more than one presenting issue.
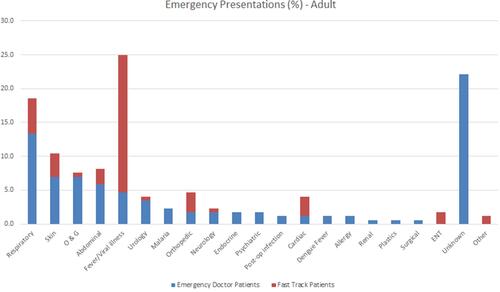
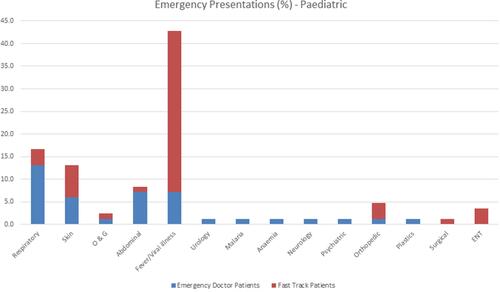
Figure 5 Paediatric patients seen in emergency by presentation (%).