Figures & data
Figure 1 Enrollment flow chart of study.
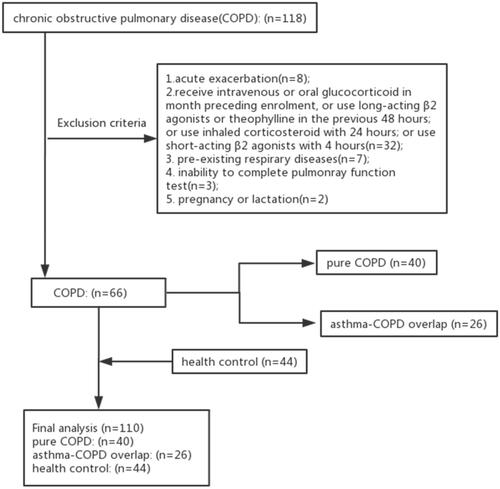
Figure 2 Quantitative measurement of airways by HRCT.
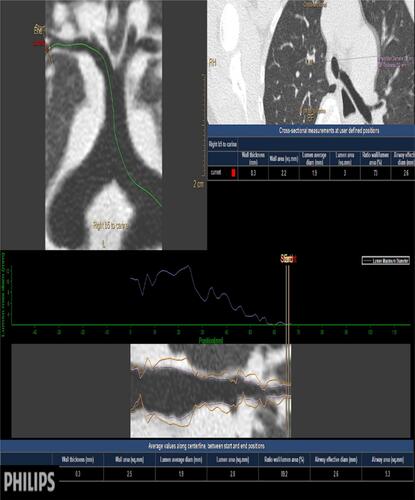
Figure 3 Quantitative measurement of emphysema and air trapping by HRCT.
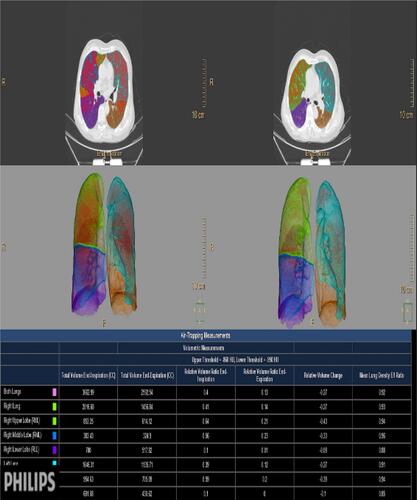
Table 1 Comparison of General Information Among the Healthy Control, COPD Patients, and ACO Patients
Table 2 Pulmonary Function Test Results Among the Healthy Control, COPD Patients, and ACO Patients
Table 3 Quantitative HRCT Parameters Among the Healthy Control, COPD Patients, and ACO Patients
Table 4 Multivariate Analysis of the Association of RVC−856 to −950, R5-R20, R5 and X5 with ACO Among COPD Patients
Table 5 ROC Curves for RVC−856 to −950 Combined with R5-R20 in Predicting ACO
Figure 4 ROC curves for RVC−856 to −950 combined with R5-R20 in predicting ACO.
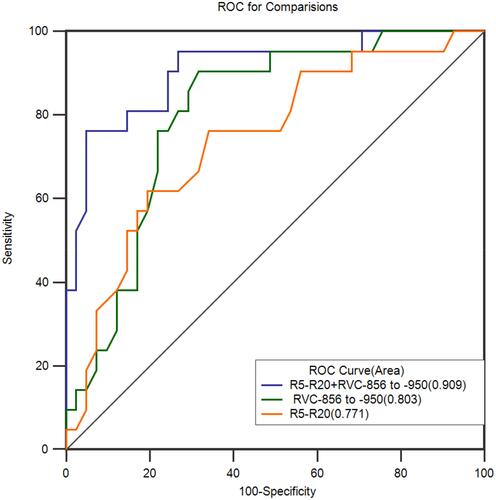
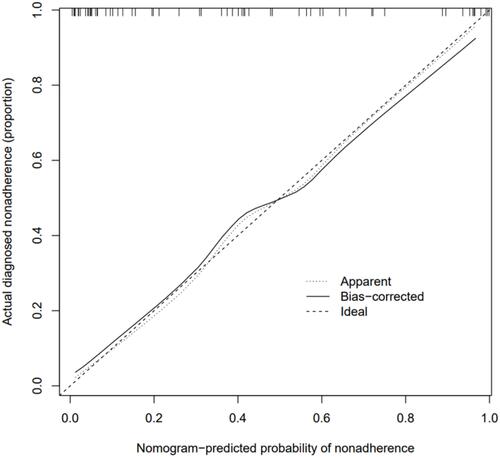
Figure 5 Calibration curve of RVC−856 to-950 combined with R5-R20.