Figures & data
Table 1 The PICO (Population, Intervention, Comparator, Outcome) and Study Design for the Systematic Review
Figure 1 PRISMA flow chart showing the studies identification process from EMBASE and Medline databases.
Notes: Adapted from: Moher D, Liberati A, Tetzlaff J, Altman DG. Preferred reporting items for systematic reviews and meta-analyses: the PRISMA statement. PLoS Med. 2009;6(7):e1000097.Citation62 Creative Commons.
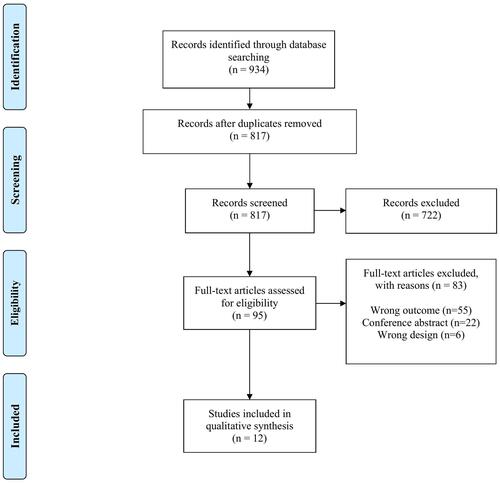
Table 2 Characteristics of Included Studies
Figure 2 The average percentage change and absolute change in MMEF, FEF50, FEV1 and FVC across asthma studies.
Notes: Left vertical axis is % of change in MMEF, FEF50, FEV1 and FVC in asthmatic patients. Right Vertical axis is absolute change in MMEF, FEF50, FEV1. Data presented are means ± standard deviation (SD). Included data has been taken and adapted from Fakhrian et al,35 Castro et al,Citation43 Ohwada et al,Citation40 Mariotta et al,Citation38 Schecker et al,Citation42 Rajkumar et al,Citation41 Elkhatib et al,36 and Lipworth et al.Citation37 Measure of variances is not displayed in the error bars for Rajkumar et alCitation41 and severe asthmatic patients in Lipworth et alCitation37 because SD was not reported. *BDR is statistically significant. **BDR is clinically significant according to ATS/ERS criteria.
Abbreviations: MMEF, mean mid-maximal expiratory flow; FEV1, forced expiratory volume in 1 second; FVC, forced vital capacity; FEF50, forced expiratory flow at 50% of FVC.
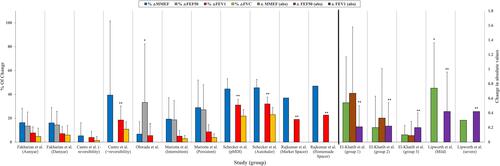
Figure 3 The % of change in spirometry indices (MMEF, FEV1, and FVC) and in oscillometry indices (X5, Fres, and R5) in COPD patients.
Notes: Vertical axis is % of change in spirometry indices and oscillometry indices across different doses of salbutamol Borrill et al.Citation26 Data presented in the figure are mean (95% CI) for Borrill et alCitation26 and mean and standard error for Park et alCitation45 *BDR is statistically significant. **BDR is clinically significant according to ATS/ERS criteria.
Abbreviations: MMEF, mean mid-maximal expiratory flow; FEV1, forced expiratory volume in 1 second; FVC, forced vital capacity; mcg, microgram. X5, reactance at 5 hertz; Fres, resonant frequency; R5, resistance at 5 hertz; FEV1, forced expiratory volume in 1 second.
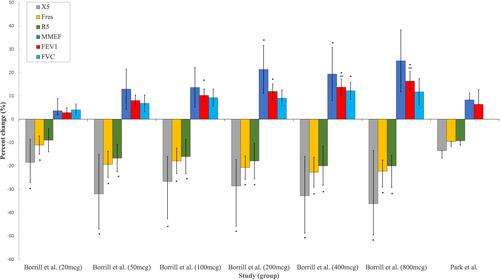
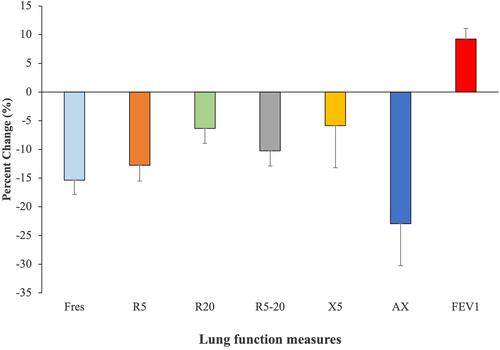
Figure 4 The percentage change of IOS parameters and FEV1 in Asthmatic patients following BDR.
Notes: Vertical axis is % of change in oscillometry parameters in comparison to FEV1 in asthmatic patients. Data is adapted from Park et al.Citation45 Data presented in the figure are the mean % change (± standard error of mean (SEM)).
Abbreviations: X5, reactance at 5 hertz; Fres, resonant frequency; R5, resistance at 5 hertz; R20, resistance at 20Hertz; R5-20, the difference between R5 and R20; AX, area of reactance; FEV1, forced expiratory volume in 1 second.