
Figures & data
Figure 1 Study scheme.
Abbreviations: COPD, chronic obstructive pulmonary disease; IL-6, interleukin 6.
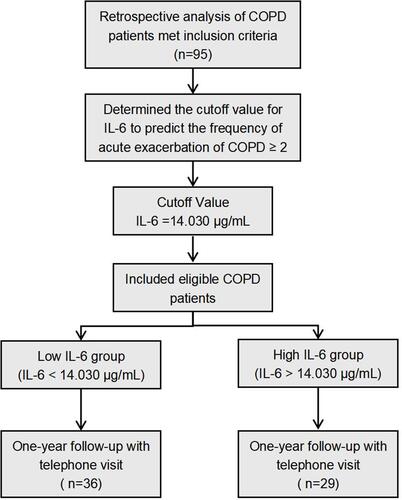
Table 1 Characteristics of COPD Patients (n=95)
Table 2 Correlation Between hs-CRP, IL-6 and Clinical Data
Table 3 Risk Factors of the Frequency of Acute Exacerbation of COPD ≥ 2 Using Binary Regression Analysis
Figure 2 ROC analysis of IL-6 in predicting the frequency of acute exacerbation of COPD ≥ 2.
Abbreviations: IL-6, interleukin 6; AUC, the area under the curve.
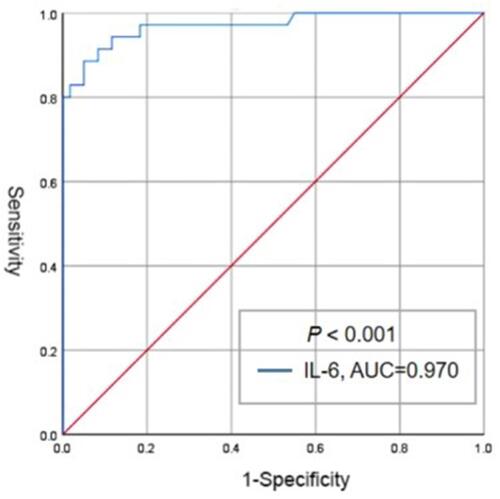
Table 4 Compared the Frequency of Acute Exacerbation Between Different Groups After One-Year Follow-Up