Figures & data
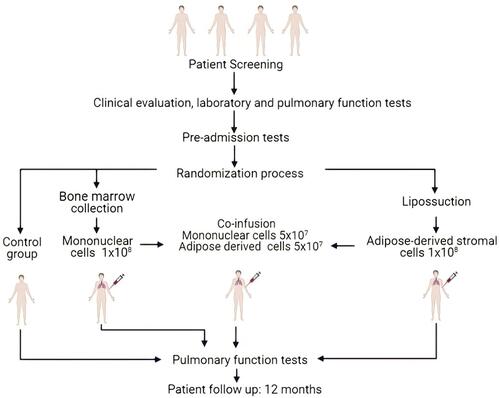
Figure 1 Schematic representation of sample selection and experimental design.
Figure 2 Cytogenetic analysis of ADSC maintained in culture until the third passage and characterization by immunophenotyping and differentiation of the ADSC and Co-infusion (ADSC and BMMC) groups.
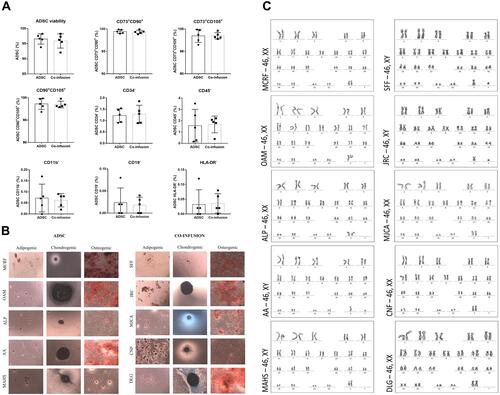
Figure 3 Different parameters of pulmonary function by means of spirometry and plethysmography for Control, BMMC, ADSC and Co-infusion (BMMC and ADSC) groups. The data refer to the mean of the 5 patients in each group. (A) FEV1 (%) post- bronchodilator, (B) FEV/FVC(%), (C) TLC (%), (D) RV(%), (E) DLCO (%), (F) pCO2.
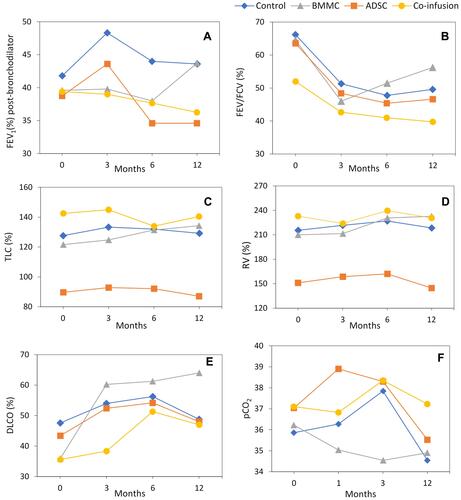
Table 1 Different Pulmonary Function Parameters Over 12 Months in Relation to Baseline Data Before Treatment for the Control, BMMC, ADSC and Co-Infusion Groups
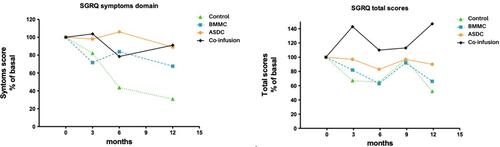
Figure 4 Saint George Hospital Respiratory Disease Questionnaire (SGRQ).