Figures & data
Table 1 Primer Sequence
Figure 1 PM2.5 stimulation induced airway remodeling and emphysema in mice. Mice were exposed to LOW-PM2.5 (50μg/20μL) and MID-PM2.5 (100μg/20μL) via a tracheal drip twice a week for 4 weeks. (A) H&E staining showed that different concentrations of PM2.5 induced emphysema-like lesions in mice. (B) Different concentrations of PM2.5 increased the MLI in mice. (C) Lung function tests showed that different concentrations of PM2.5 decreased the PEF. (D) The lung function test showed that different concentrations of PM2.5 decreased the PIF. (E) H&E staining showed that PM2.5 induced airway remodeling. (F) PM2.5 increased the level of WAt/Pbm (μm2/μm). (G) Immunohistochemistry showed that PM2.5 induced α-SMA expression in the mouse lung tissue. (H) PM2.5 increased the ratio of WA%. (I) PM2.5 increased the area of α-SMA-positive staining. *P<0.05, **P<0.01, ***P<0.001, compared to the control group, n=5.
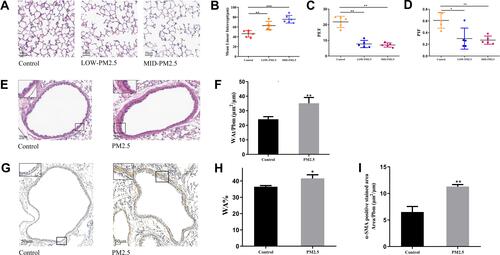
Figure 2 PM2.5 induced HBSMC proliferation. HBSMCs were stimulated with 3 μg/mL PM2.5 for 24 h or 48 h. (A–C) Western blot analysis showed that PM2.5 induced the expression of PCNA and α-SMA. **P<0.01, compared to the control group, n=3.
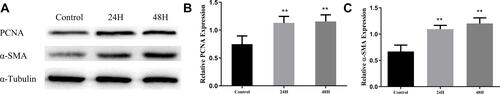
Figure 3 PM2.5 increased Wnt5a/β-Catenin pathway activation in the mice lung tissue. (A–C) Western blot analysis showed that PM2.5 increased Wnt5a and β-Catenin expression in the mice lung tissue. (D–F) Western blot analysis showed that PM2.5 increased PDGFRβ and tenascin C expression in the mice lung tissue. *P<0.05, **P<0.01, compared to the control group, n=5.
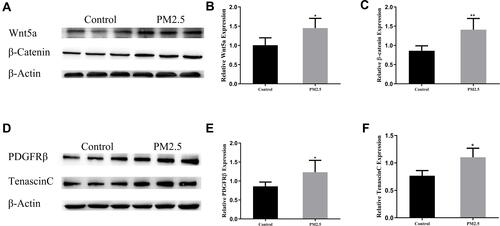
Figure 4 PM2.5 increased Wnt5a/β-Catenin pathway activation in HBSMCs. HBSMC were exposed to PM2.5 (3 μg/mL) for 48 h. (A–C) Western blot analysis showed that PM2.5 induced Wnt5a and β-Catenin expression in HBSMCs. (D–F) Western blot analysis showed that PM2.5 induced PDGFRβ and Tenascin C expression in HBSMC. (G) Immunofluorescence staining showed that PM2.5 increased the expression of β-Catenin in HBSMCs. (H) Real-time PCR results showed that PM2.5 increased the expression of the Wnt5a, β-Catenin, TGF-β1, c-myc and CyclinD1 mRNAs in HBSMCs. *P<0.05, **P<0.01, ***P<0.001, compared to the control group, n=3.
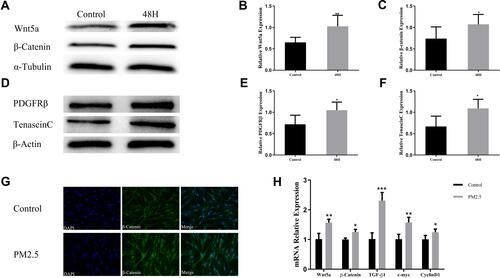
Figure 5 BOX5 alleviated PM2.5-induced airway remodeling in mice. Mice were randomly divided into PBS, PM2.5, BOX5, and PM2.5+BOX5 groups. (A) H&E staining showed that BOX5 alleviated the PM2.5-induced airway wall thickening. (B) Immunohistochemistry showed that BOX5 decreased PM2.5-induced increase in α-SMA protein expression. (C) BOX5 decreased the PM2.5-induced increase in WAt/Pbm (μm2/μm). (D) BOX5 decreased the PM2.5-induced increase in WA%. (E) BOX5 decreased the PM2.5-induced increase in the α-SMA-positive area. (F–H) Western blot analysis showed that BOX5 reduced PM2.5-induced increases in Wnt5a and β-Catenin expression in the mouse lung tissue. (I–K) Western blot analysis showed that BOX5 reduced the PM2.5-induced increases in PDGFRβ and tenascin C expression in the mice lung tissue. *P<0.05, **P<0.01, n=5.
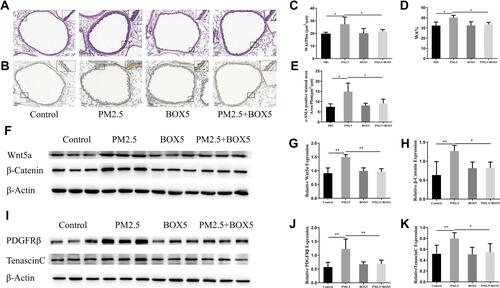
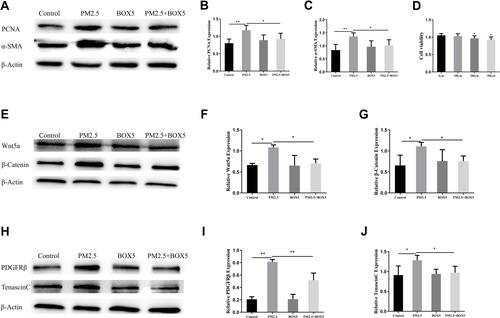
Figure 6 BOX5 alleviated PM2.5-induced HBSMC proliferation. HBSMCs were divided into PBS, PM2.5, BOX5, and PM2.5+BOX5 groups. (A–C) Western blot analysis showed that BOX5 downregulated PM2.5-induced increases in PCNA and α-SMA expression in HBSMCs. (D) The CCK8 assay showed that cell viability did not significantly change after 48 h of BOX5 (100 μM) treatment, but cell viability decreased after 200 μM and 300 μM BOX5 treatment. (E–G) Western blot analysis showed that BOX5 downregulated the PM2.5-induced increases in Wnt5a and β-Catenin expression in HBSMCs. (H–J) Western blot analysis showed that BOX5 downregulated the PM2.5-induced increases in PDGFRβ and tenascin C expression in HBSMCs. *P<0.05, **P<0.01, n=3.