Figures & data
Figure 1 Graphical scheme of the protocol for cigarette smoke extract (CSE) or/and lipopolysaccharide (LPS) inducing pulmonary emphysema.
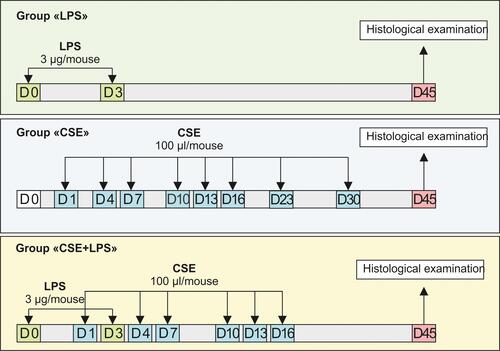
Figure 2 Graphical scheme of the protocol for studying the spiperone effects in vivo.
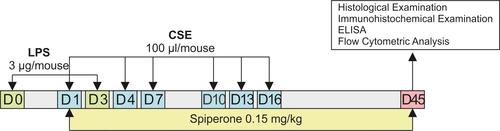
Figure 3 Graphical scheme of the protocol for CD31+ lung endothelial cells cultivation with dopamine and spiperone.
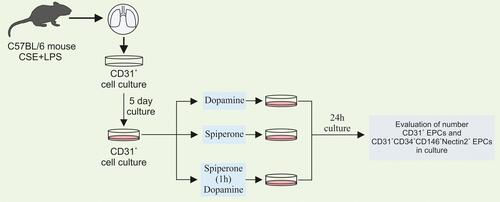
Figure 4 Micrographs of lung sections (middle pulmonary field) obtained from female C57BL/6 (A) mice of intact control; (B) mice treated with LPS; (C) mice treated with CSE; (D) mice treated with LPS and CSE (d) on d45. Tissues were stained with hematoxylin-eosin. × 100. Scale bar 50 μm. Morphometry of the lungs of females C57BL/6 mice on d45: (E) Mean linear intercept (Lm); (F) destructive index (DI); (G) the number of capillaries in 5 consecutive fields of lungs sections (upper, middle and lower pulmonary field). Groups: intact control – group from intact mice (Intact control), mice treated with LPS (LPS), mice treated CSE (CSE), mice treated with LPS and CSE (LPS + CSE). * – for comparison with the intact control group by Mann–Whitney test; + – for comparison with the LPS control group by Mann–Whitney test; ● – for comparison with the CSE group by Mann–Whitney test.
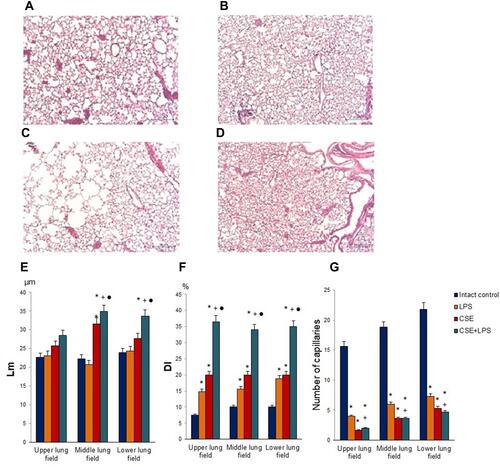
Figure 5 Photomicrographs of lungs sections (lower pulmonary field) obtained from female C57BL/6 mice on d45 (A–C). Tissues were stained with hematoxylin-eosin. Scale bar 10 μm. The arrows indicate the rupture of the alveoli. (A) Section from control group; (B) section from mice with CSE/LPS-induced emphysema; (C) section from mice with emphysema treated with Spiperone between d1-d45. At least 10 photomicrographs of the lung tissue at × 100 magnification were taken for each experimental animal from all experimental groups. (D–I) Quantification of pulmonary emphysema and morphometry of the lungs of females C57BL/6 mice on d45: (D–F) Lm and (G–I) DI values of mice; (D and G) Upper; (E and H) Middle; (F and I) Lower pulmonary field. Results are expressed as means ± SEM. n =10 animals/group; * - for comparison with the Intact control group by Mann–Whitney test; ● - for comparison with the CSE+LPS group by Mann–Whitney test.
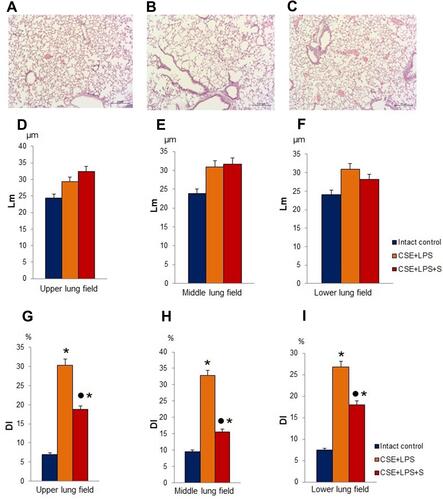
Figure 6 The number of capillaries in 5 consecutive fields of lungs sections (upper, middle and lower pulmonary field) obtained from female C57BL/6 mice on d45. (A) Upper lung field; (B) middle lung field; (C) lower lung field. Groups: intact control – control group from intact mice, CSE+LPS – mice with CSE/LPS-induced emphysema, CSE+LPS+S – mice with emphysema treated with Spiperone. Results are presented as the mean±SEM. *- for comparison with the Intact control group by Mann–Whitney test; ● - for comparison with the CSE+LPS group by Mann–Whitney test.
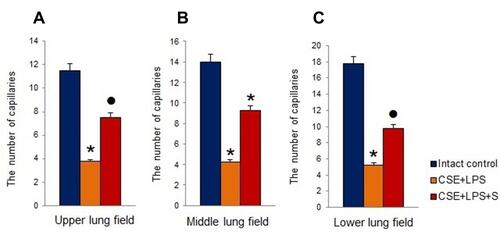
Figure 7 Immunohistochemical expression of specific cellular markers: (A–C) CD16 and (E–G) CD31 in the lungs (lower pulmonary field) from female C57BL/6 mice on d45. All sections were counterstained with hematoxylin. Scale bar 10 μm. The arrows indicate positive cells. (A and E) section from control group; (B and F) section from mice with CSE/LPS-induced emphysema; (C and G) Section from mice with emphysema treated with Spiperone between d1-d45; (D) immunohistochemical staining for CD16 in the lungs from female C57BL/6 mice on d45; (H) immunohistochemical staining for CD31 in the lungs from female C57BL/6 mice on d45. The α1-antitrypsin concentration in the serum (I) and the levels of α1-antitrypsin (J), MMP 9 (K), and MMP 12 (L) in lung homogenate of female C57BL/6 mice with lung damage caused by intratracheal administration of CSE and LPS on d45. Groups: intact control – control group from intact mice, CSE+LPS – mice with CSE/LPS –induced emphysema, CSE+LPS+S – mice with emphysema treated with Spiperone. Results are presented as the mean±SEM. * - for comparison with the Intact control group by Mann–Whitney test (p < 0.05); • - for comparison with the CSE+LPS group by Mann–Whitney test p < 0.05.
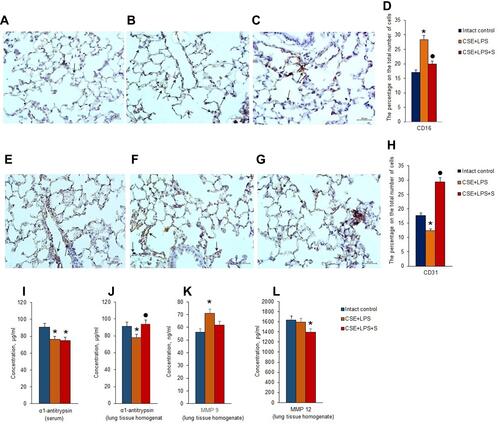
Figure 8 Characterization of endothelial progenitor cells, VEGF2+ endothelial cells and angiogenesis precursors in lungs and blood of female C57BL/6 mice on d45. Cells were analyzed by flow cytometry using antibodies against CD45, CD31, CD34, CD117, and CD309. Dot plots are representative for three independent experiments with the mean from three independent experiments. (A) The number of angiogenesis precursors (CD45−СD117+CD309+) in lungs of female C57BL/6 mice; (B) the number of angiogenesis precursors (CD45−СD117+CD309+) in blood of female C57BL/6 mice; (C) the number of VEGF2+ endothelial cells (CD45−СD309+) in lungs of female C57BL/6 mice; (D) the number of VEGF2+ endothelial cells (CD45-СD309+) in blood of female C57BL/6 mice; (E) the number of endothelial progenitor cells (CD45−СD34+CD31+) in lungs of female C57BL/6 mice; (F) the number of endothelial progenitor cells (CD45−СD34+CD31+) in blood of female C57BL/6 mice. Groups: intact control – control group from intact mice, CSE+LPS – mice with CSE/LPS –induced emphysema, CSE+LPS+S – mice with emphysema treated with Spiperone. Results are presented as the mean±SEM. * - for comparison with the Intact control group by Mann–Whitney test (p <0.05); ● - for comparison with the CSE+LPS group by Mann–Whitney test (p < 0.05). (G) Histogram of isotype control for IgG2b (PerCP); (H) Dot plot of isotype control for IgG2b (PE-Cy7), and IgG2b (APC); (I) Histogram of CD45 (PerCP) expression; (J) Phenotype establishment and qualitative analysis of CD117 (PE-Cy7) and CD309 (APC) expression; (K) Isotype control for IgG2b (APC); (L) Histogram of CD309 APC expression.
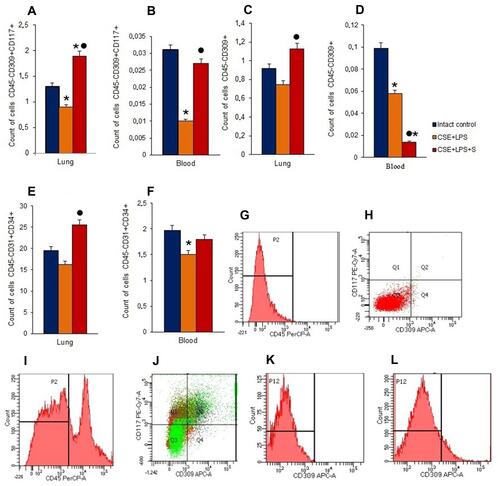
Figure 9 Characterization of Notch1+ endothelial cells in lungs female C57BL/6 mice on d45. Cells were analyzed by flow cytometry using antibodies against CD45, CD31, CD34, CD117, CD309 and Notch1. Dot plots are representative for three independent experiments with the mean from three independent experiments. (A) The number of angiogenesis precursors (CD45−СD117+CD309+Notch1+) in lungs of female C57BL/6 mice; (B) the number of VEGF2+ endothelial cells (CD45−СD309+Notch1+) in lungs of female C57BL/6 mice; (C) the number of endothelial progenitor cells (CD45−СD34+CD31+Notch1+) in lungs of female C57BL/6 mice. Groups: intact control – control group from intact mice, CSE+LPS – mice with CSE/LPS-induced emphysema, CSE+LPS+S – mice with emphysema treated with Spiperone. Results are presented as the mean±SEM. * - for comparison with the Intact control group by Mann–Whitney test (p < 0.05); ● - for comparison with the CSE+LPS group by Mann–Whitney test (p < 0.05). (D) Histogram of CD45 (PerCP) expression; (E) Phenotype establishment and qualitative analysis of CD117 (PE-Cy7), and CD309 (APC) expression; (F) Histogram of Notch1 PE expression.
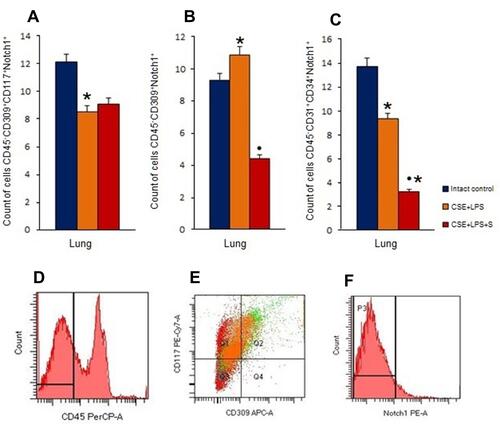
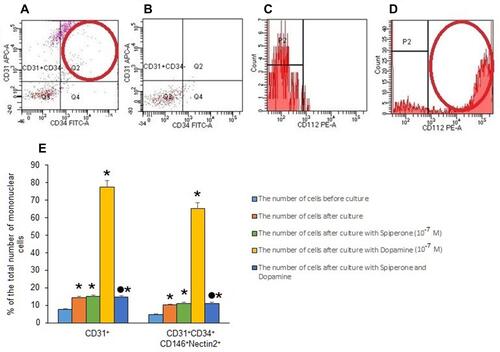
Figure 10 Characterization of Nectin2+endothelial cells in lungs from female C57BL/6 mice on d45. Cells were analyzed by flow cytometry using antibodies against CD45, CD31, CD34, CD146, and CD112 (Nectin2). (A) Phenotype establishment and qualitative analysis of CD31 (APC) and CD34 (FITC) expression; (B) Dot plot of isotype control for IgG2b (APC) and IgG2a (FITC); (C) Histogram of isotype control for IgG2b (PE); (D) Histogram of CD112 (Nectin 2) (PE) expression; (E) the effect of dopamine and spiperone on the content of mature endothelial cells and their precursors (% of the total number of mononuclear cells) in a culture of mononuclear cells isolated from lungs of female C57BL/6 mice with emphysema by CSE and LPS on d45 (M±m). Results of 3 independent experimental series are presented. Groups: group 1 - control group (CD31+cells before culture), group 2 – CD31+ cells after d5 culture, group 3 – CD31+ cells after culture with spiperone (10−7 M), group 4 – CD31+ cells after culture with dopamine (10−7 M), and group 5 – CD31+ cells after culture with spiperone (10−7 M) and dopamine (10−7 M). * - p < 0.05 significance of difference compared with group 1. ● - p < 0.05 significance of difference compared with group 2.