Figures & data
Figure 1 Flow diagram.
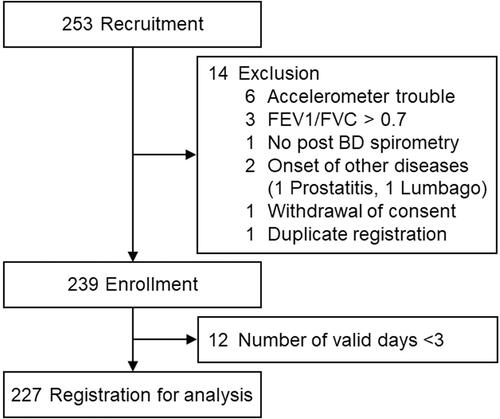
Table 1 Characteristics
Table 2 Simple Regression Analysis Results
Table 3 Multiple Regression Analysis Results
Table 4 Factors Detected by the Stepwise Method
Figure 2 Reference equations of physical activity. METs, metabolic equivalents. Units: Duration at ≥2.0 METs (min), Duration at ≥3.0 METs (min), Total activity at ≥3.0 METs (METs∙h), Step count (steps), 6MWD (m), mMRC (point), HADS-A (point), FEV1 %pred (%), age (years old), BNP (pg/mL).
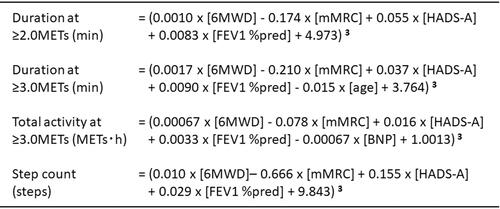
Figure 3 Relationships between the measured and predictive values. (A) duration at ≥2.0 METs; r=0.462, P<0.0001, (B) duration at ≥3.0 METs; r=0.598, P<0.0001, (C) total activity at ≥3.0 METs; r=0.614, P<0.0001, (D) Step count; r=0.539, P<0.0001.
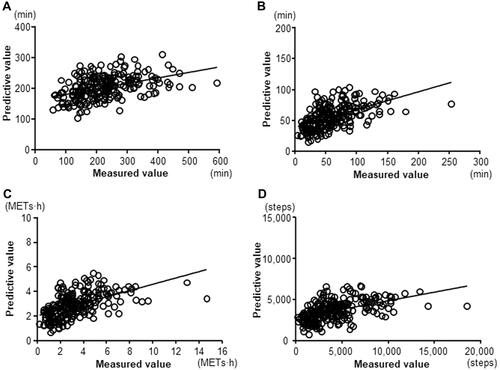
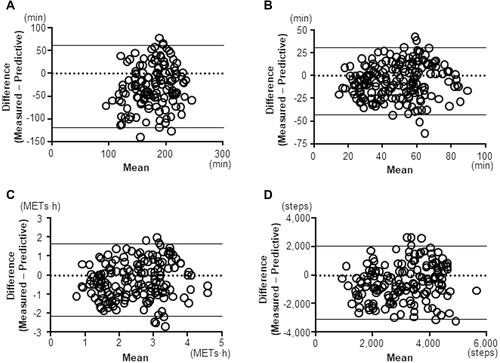
Figure 4 Bland-Altman Plots. (A) duration at ≥2.0 METs, (B) duration at ≥3.0 METs, (C) total activity at ≥3.0 METs, (D) Step count.
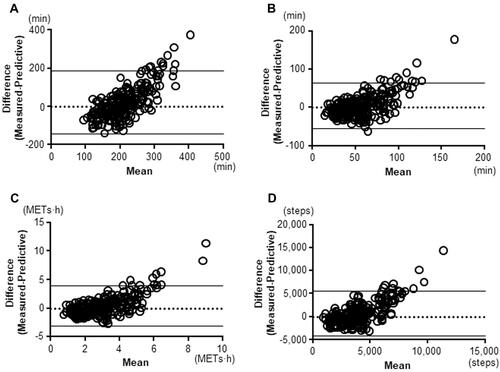
Figure 5 Bland-Altman Plots after excluding highly active patients. (A) duration at ≥2.0 METs (patients with <231 minutes of measured value), (B) duration at ≥3.0 METs (patients with <87 minutes of measured value), (C) total activity at ≥3.0 METs (patients with <4.4 METs∙h of measured value), (D) Step count (patients with <5108 steps of measured value).