
Figures & data
Figure 1 Global transcript profiling of the peripheral blood monocytes isolated from Control (Never Smokers and Control Smokers) and COPD (COPD Smokers and COPD Ex-Smokers) groups was performed. To identify the effect of smoking, differentially expressed genes between Never-smokers and Control Smokers were studied, while the effect of COPD was studied by performing differential display between control smokers and COPD smokers. To obtain information about the effect of smoking cessation on expression of genes associated with COPD, genes differentially expressed in COPD smokers and COPD Ex-smokers were studied. To study the status of COPD related expression, genes which were found to be differentially regulated in the control smokers and COPD smokers were compared with the Ex-smoker COPD group. The genes which were found to be differentially regulated in the Never-smokers and Control smokers were compared with that in the Ex-smoker COPD group to study the status of smoking related genes. It was assumed that the effects of target variables on the whole-genome transcript expression were liable to exhibit simple summative effect.
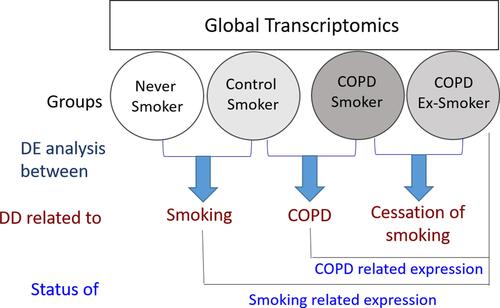
Figure 2 Whole genome human transcriptomics of peripheral blood monocytes isolated from Never smokers, Control smokers, COPD smokers and COPD Ex-smokers was performed. COPD Patients (GOLD 1–3) were recruited from hospital OPD and controls from hospital staff following written consent. Anthropometric parameters were collected, spirometry was performed followed by blood sample collection. Peripheral blood mononuclear cells (PBMCs) were isolated by using Histopaque followed by isolation of monocytes using CD14 microbeads. Total RNA was extracted from CD14+ monocytes followed by quality check and quantification of RNA using Bioanalyzer and Nanodrop. Whole genome expression microarray was performed using Agilent one colour (Cy3) microarray protocol. Out of 41 samples, 25 samples did not pass the quality check and were not used further for microarray experiment. Samples (n = 16) with RIN score ≥8 were used further. Alongside exploratory analyses, viz. PCA and unsupervised HCA, differential display from the expression microarray data between different subgroups were done. Orthogonal validation of expression for two genes (TNFRSF1A and CASP9) was done using different samples (n = 5) by RT-PCR according to MIQE guidelines.
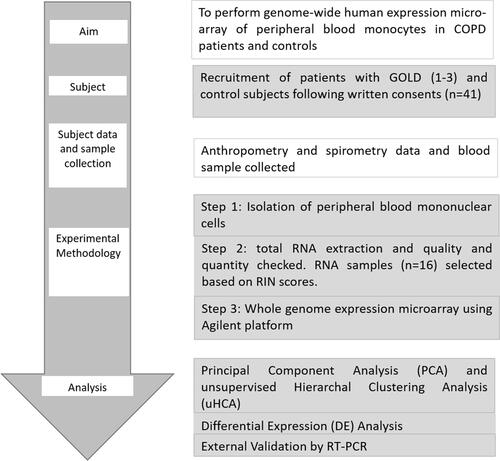
Table 1 Demographic and Spirometric Data of the Subjects in Two Groups
Figure 3 (A) Venn diagram showing commonly regulated genes between the subgroups of Control: Control Never Smokers (CNS) and Control Smokers (CS). Out of 19,906 genes expressed in CNS and 18,815 genes expressed in CS, 8170 common genes were expressed in the two subgroups of controls, while 11,736 genes were expressed only in Control Never smokers and 10645 genes were expressed only in Control smokers. (B) Volcano plot of Control Smoker Vs Control Never Smoker analysed using Mann–Whitney U-test at >2-fold, p value<0.05. (C) Venn diagram showing common genes expressed in the subgroups of COPD: COPD Ex-Smokers and COPD Smokers. Out of 14,457 genes expressed in COPD Ex-Smokers and 14,881 genes expressed in COPD S, 8818 genes were expressed in both subgroups of COPD, while 5639 genes were expressed only in COPD Ex-Smokers and 6063 genes were expressed only in COPD Smokers. (D)Volcano plot of COPD Smoker Vs COPD Ex-Smoker analysed using Mann Whitney U-test at>2-fold; p value<0.05.
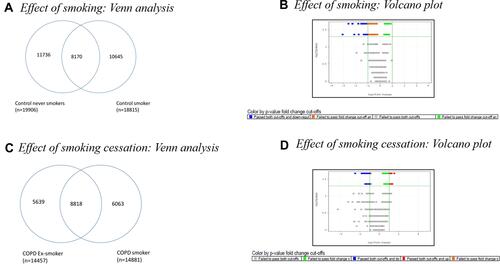
Figure 4 (A) Venn diagram showing common genes expressed in the subgroups of Control and COPD: Control Smokers (CS) and COPD Smokers (COPD (S). Out of 18,815 genes expressed in CS and 14,881 genes expressed in COPD S, 8943 genes were expressed in both subgroups of controls and COPD: CS and COPD S, while 9872 genes were expressed only in Control smokers and 5938 genes were expressed only in COPD smokers. (B) Volcano plot of Control Smoker Vs COPD Smoker analysed using Mann Whitney U-test at>2-fold; p value<0.05.
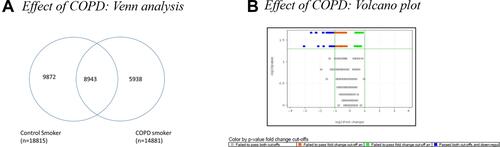
Figure 5 Work flow of analysis. Number in parenthesis shows the number of (I) genes expressed in that particular subgroups: CNS (n=19,906), CS (n=18,815), COPD Ex-S (n=14,457) and COPD S (n=14,481), (II) genes (n =1845) expressed in all 4 subgroups, (III) n=1912 genes were found to be commonly expressed in smoking group (p<0.05 and FC>2). (IV) n= 6707 genes were found to be uniquely expressed in the COPD group when compared to controls. (V) Genes uniquely expressed in smoking group and COPD group were subjected to GeneGOMetacore analysis.
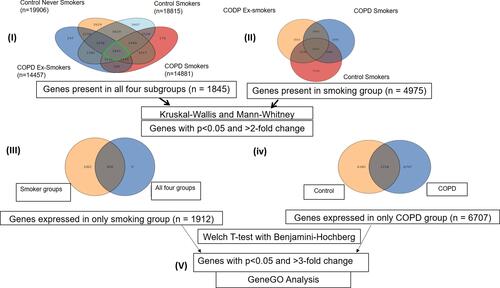
Figure 6 Top scored process networks enriched by GeneGO analysis. The details are provided in Methods section.
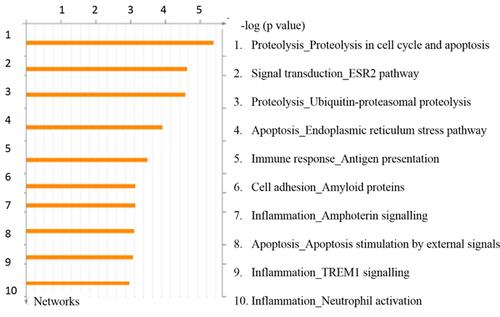
Figure 7 Fold changes in microarray and real time RT-PCR experiment. Microarray data (shown in blue) were validated (p< 0.01) by estimating transcript copy numbers by performing real time RT-PCR (shown in Orange) of two (2) candidate genes selected on the basis of post-hoc enrichment analysis using different sets of five (5) samples from four subgroups (COPD-S, COPD-ExS, CNS and CS) as explained in the Methods section.
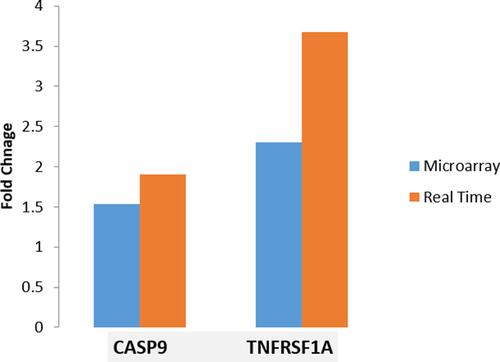
Table 2 Categorical List of Genes Showing Differential Expression in the Monocytes Isolated from COPD (COPD Smokers and COPD Ex-Smokers) and Control (Control Smokers and Control Never Smokers) Subjects