Figures & data
Table 1 Characteristics of the Patients at the Baseline
Figure 1 Graphical representation of the factors related to reduction of sedentary time created using a graphical model. Factors with a direct link are connected by lines. The thickness of the line represents the strength of the relationship. The thick lines indicate an absolute value of the correlation coefficient of > 0.4, and the thin line represents a correlation coefficient of 0.2–0.4. The red circle stands for changes in physical activity of 1.0–1.5 METs. The green circle shows treatment with tiotropium/olodaterol, the Orange circles show pulmonary function, the blue circles show clinical characteristics, and the yellow circles represent baseline physical activities.
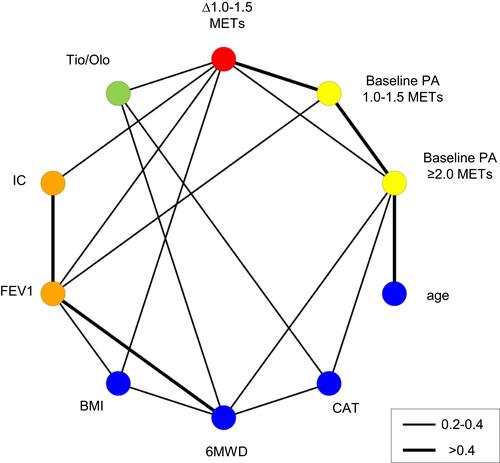
Figure 2 Changes in sedentary time before and after treatment stratified according to pulmonary function. Patients were stratified into two groups by a median IC of 1970 mL (A), FEV1 of 1510 mL (B), median FVC of 2840 mL (C), and median VC of 3010 mL (D), for stratified analysis of a reduction in sedentary time with Tio or Tio/Olo treatment. The error bars represent standard errors. p values show differences between two groups. In the subgroup of patients with lower baseline IC, Tio/Olo treatment significantly reduced sedentary time compared with Tio treatment.
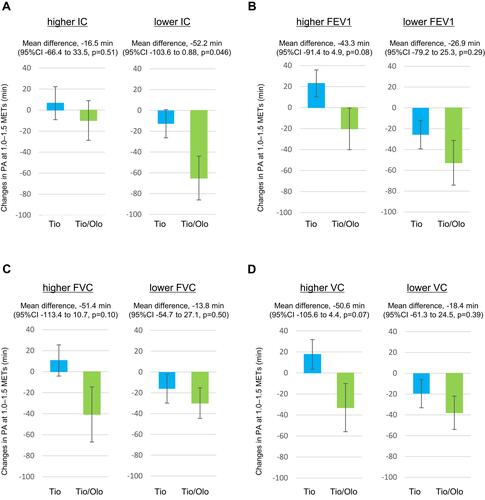
Figure 3 Changes in sedentary time before and after treatment stratified by the duration and intensity of physical activity at study entry. Patients were divided into two groups based on a median duration of PA of 1.0–1.5 METs intensity of 282.7 min (A), median duration of PA of ≥ 2.0 METs intensity of 125.1 min (B), and median duration of PA of ≥ 3.0 METs intensity of 31.1 min (C), for stratified analysis of reduction in sedentary time with Tio or Tio/Olo treatment. The error bars represent standard errors. p values show differences between two groups. In the subgroup of patients with a shorter duration of baseline physical activity of ≥2 METs, Tio/Olo treatment significantly reduced sedentary time compared with Tio treatment.
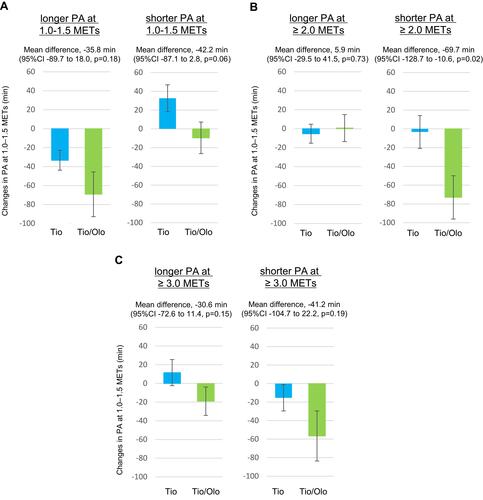
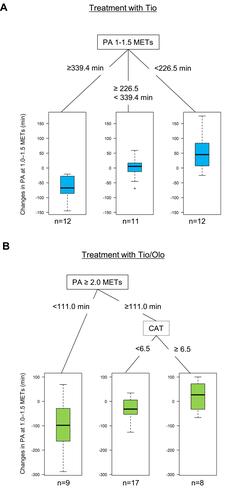
Figure 4 Decision tree about treatment with Tio or Tio/Olo in treatment-naïve COPD patients. The decision tree was obtained by statistical analysis including patient characteristics (age, BMI, CAT, and 6MWD), pulmonary functions (FEV1, FVC, VC, and IC), and baseline physical activity of 1.0–1.5 METs, PA ≥ 2.0 METs, and PA ≥ 3.0 METs intensity as confounding factors. The decision trees show treatment with Tio (A), and Tio/Olo (B). Tio treatment was most effective for reduction of sedentary time in patients in whom the daily duration of baseline PA of 1.0–1.5 METs was more than 339.4 min. Tio/Olo treatment was most effective in patients in whom the duration of baseline PA of ≥ 2.0 METs was shorter than 111.0 min.