
Figures & data
Table 1 Baseline Characteristics of Study Population Prior to Propensity Score-Matching Analysis
Table 2 Baseline Characteristics of Study Patients After Propensity Score-Match Analysis
Figure 1 Flowchart of selection of the study population.
Abbreviation: AFL, airflow limitation.
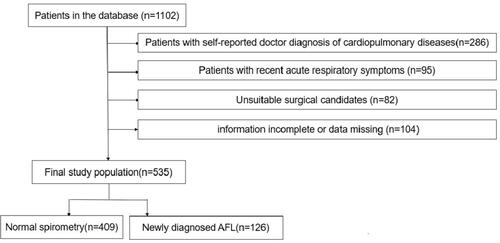
Table 3 Multivariate Logistic Regression Analysis to Assess Predictors of PPCs
Table 4 Postoperative Outcomes Prior to Propensity Score-Match Analysis
Figure 2 Kaplan-Meier cumulative event curves of all-cause death before propensity score-matching.
Abbreviations: PSM, propensity score-matched analysis; AFL, airflow limitation.
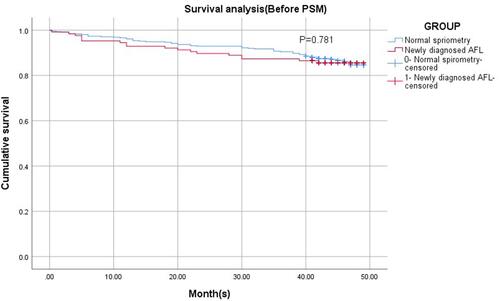
Figure 3 Kaplan-Meier cumulative event curves of all-cause death after propensity score-matching.
Abbreviations: PSM, propensity score-matched analysis; AFL, airflow limitation.
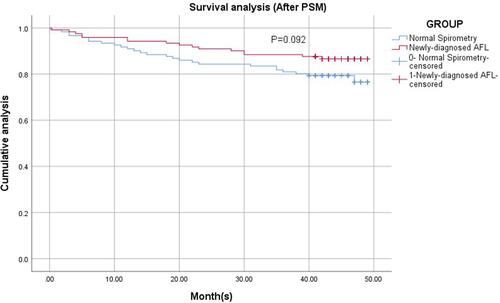
Table 5 Postoperative Outcomes After Propensity Score-Match Analysis