Figures & data
Table 1 Baseline Characteristics
Figure 1 Consort diagram of the study population. Eligible patients were recruited from in- and out-patient settings. Seventy patients were randomized to IVIG or control group in a 1:1 ratio. Number of deaths, all-cause hospitalization, severe and moderate AECOPD were reported in the flow-chart for both ITT and PP analysis.
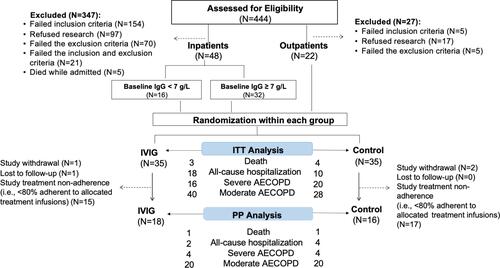
Figure 2 Study recruitment, adherence and retention. Number of patients recruited each month by recruitment settings from September 2016 to November 2018 is shown (A). Recruitment from ambulatory care clinics started in March 2018 while prespecified number of patients with hypogammaglobulinemia recruited from inpatient units was reached by March 2018. The horizontal dashed lines represent mean recruitment rate over the actual recruitment period. The combined recruitment rate was 4.5±0.9 patients/month. Proportion of allocated treatments received in patients by assigned treatment group (B). Arrows indicate numbers of patients who were adherent greater (↑) or less (↓) than 80%. Adherence was low, and more so in the control group. Retention rate by treatment group over 48 weeks was high despite low adherence (C).
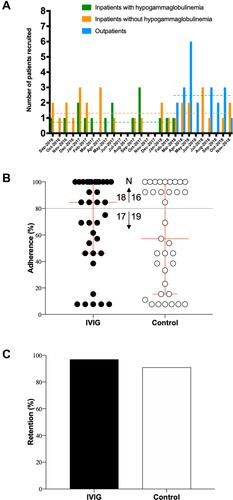
Table 2 Rates of Acute Exacerbation of COPD (AECOPD) by Treatment Allocation
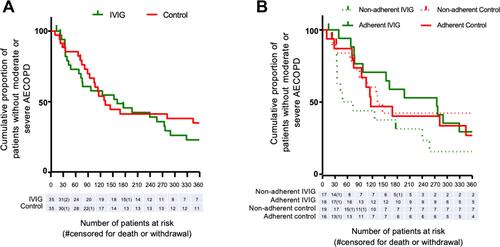
Figure 3 Kaplan–Meier curve of cases remaining without moderate or severe AECOPD, (A) regardless of non-adherence (ITT), (B) in cases with >80% adherence (PP) to study treatments.