
Figures & data
Table 1 Characteristics of Subjects in the Hokkaido COPD and Kyoto University Cohorts
Table 2 Characteristics of Groups Divided by Annual Weight Change in the Hokkaido COPD Cohort
Figure 1 Distribution of annual body weight change in the Hokkaido COPD cohort study.
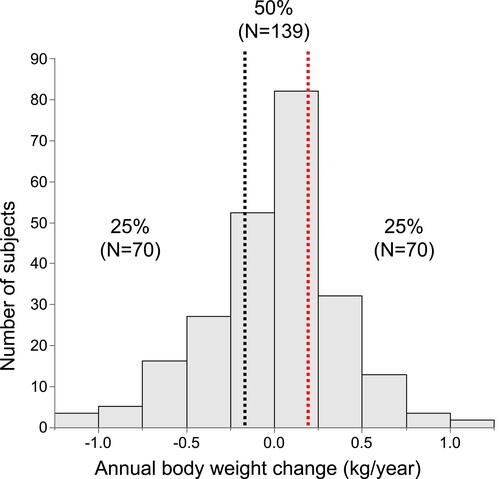
Figure 2 Kaplan–Meier curves based on groups divided by annual weight change in Hokkaido COPD cohort study. (A) All-cause mortality. (B) Patients who survived during the first 5 years. (C) Patients excluding death from malignancy.
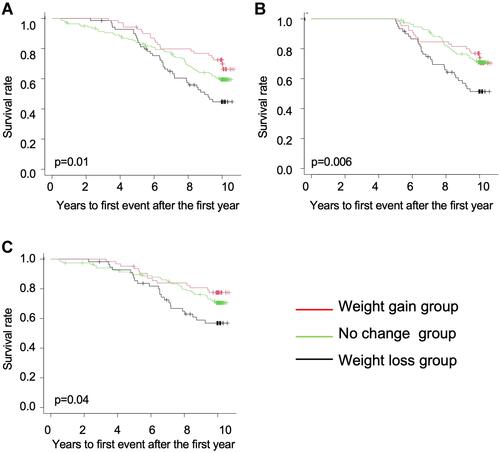
Table 3 Multivariable Cox Proportional Hazards Analysis of All-Cause Mortality in the Hokkaido COPD and Kyoto University Cohorts
Table 4 Causes of Death in the Hokkaido COPD and Kyoto University Cohorts
Table 5 Characteristics of Groups Divided by Annual Weight Change in the Kyoto University Cohort
Figure 3 Kaplan–Meier curves based on groups divided by annual weight change in Kyoto University cohort. (A) All-cause mortality. (B) Patients who survived during the first 5 years. (C) Patients excluding death from malignancy.
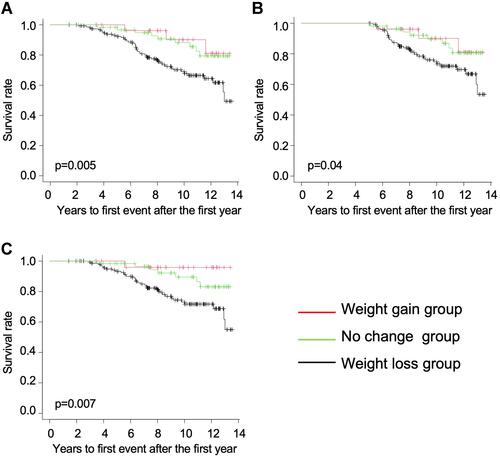
Table 6 Relative Risk for Weight Loss Group versus Others Using Logistic Regression Analysis