
Figures & data
Figure 1 Study flow chart.
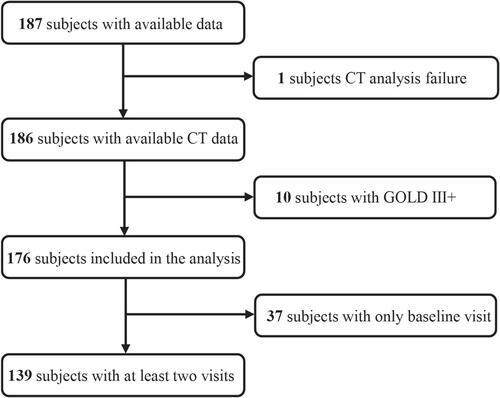
Table 1 Characteristics of the Subjects at Baseline
Table 2 Quantitative CT Parameters of the Subjects at Baseline
Figure 2 The reconstruction of the airway tree.
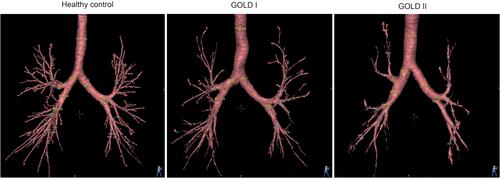
Figure 3 Computed tomography-visible total airway count by generation, average lumen diameter and average inner area. *Significantly different from healthy control (p<0.05). † Significantly different from GOLD I (p<0.05).
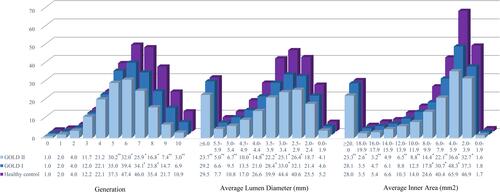
Table 3 Multivariable Linear Regression Analysis for Pulmonary Function Measurements with Imaging Measurements
Figure 4 Relationship between total airway count (n) and inspiratory Pi10 (mm). CT-visible TAC was strongly related to inspiratory Pi10 (ρ=0.750; p<0.001).
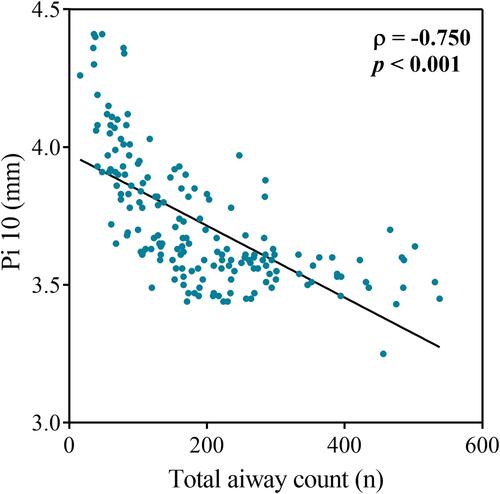
Table 4 Multivariable Linear Regression Analysis Exploring Factors Independently Associated with the Annual Decline in Pulmonary Function