
Figures & data
Table 1 Explanatory Variables Studied
Table 2 Characteristics of Participants at the Index Consultation
Figure 1 Predicted mean CCQ total scores over time (note full CCQ total score ranges from 0 to 6)*. *Dashed line denotes a difference of 0.4 from the estimated mean CCQ total score at the index consultation.
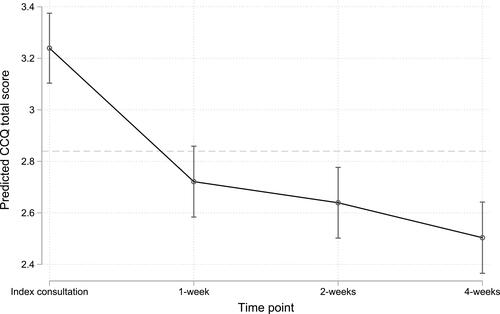
Table 3 Individual Associations Between Sociodemographic, Past Medical History, and Clinical Variables and Exacerbation Course in Patients with AECOPD in Primary Care*
Table 4 Marginal R2 Values Across Multivariable Models