
Figures & data
Figure 1 Vaccination uptake and knowledge of and intention to vaccination in the questionnaire.
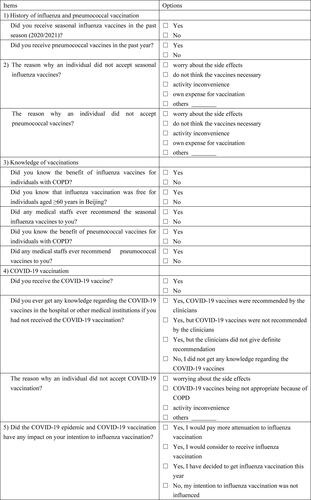
Table 1 Demographic and Clinical Characteristics (n = 264)
Table 2 The Rate of Influenza, Pneumococcal and COVID-19 Vaccination (n = 264)
Table 3 Reasons for the Patients Who Did Not Receive Influenza or Pneumococcal Vaccination
Figure 2 Distribution of the reasons why the patients did not intend to get COVID-19 vaccination (n = 110).
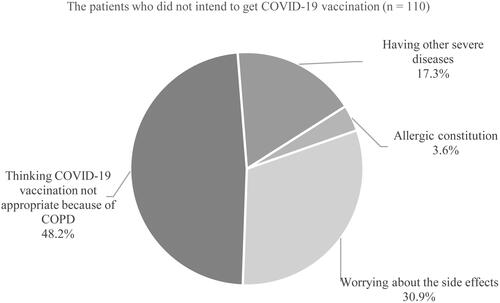
Table 4 Factors Associated with the Change of Intention to Receive Influenza Vaccination After the COVID-19 Epidemic in Beijing (n = 204)a