
Figures & data
Table 1 Patient Demographics
Table 2 Results of the Receiver Operating Characteristic Curve Analysis for COPD Exacerbation
Figure 1 Receiver operating characteristic (ROC) curve analysis for determining chronic obstructive pulmonary disease exacerbation status using diaphragm ultrasound findings. The ROC curve for distinguishing exacerbation from a stable status indicated that the outcomes were fair. The area under the curve (AUC) of the thickening fraction during maximal deep breathing (TFmax) was 0.745. The AUC of diaphragm excursion during maximal deep breathing (DEmax) was 0.721. No significant difference was observed between TFmax and DEmax for distinguishing exacerbation status (p = 0.608).
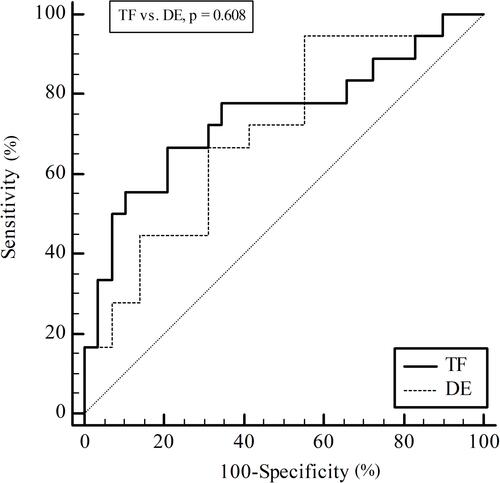
Figure 2 Multiple comparative analysis of the receiver operating characteristic (ROC) curve between diaphragm thickening, diaphragm excursion, lung function, and body mass index (BMI). The ROC curve of thickening fraction of diaphragm during maximal breathing (TFmax) (A) and diaphragm excursion during maximal breathing (DEmax) (B) showed in . (C) There was no significant difference for distinguishing exacerbation both in TFmax and DEmax compared to those of forced vital capacity (FVC), forced expiratory volume in 1 second (FEV1), and BMI in multiple comparative analysis of the ROC curve analysis.
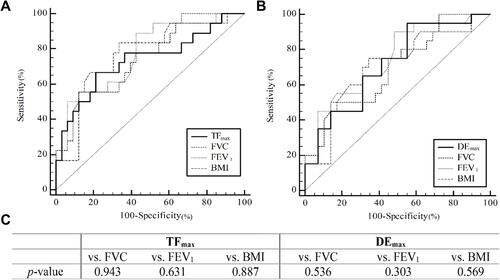
Table 3 Clinical Characteristics of COPD Patients According to Diaphragm Ultrasound Findings
Table 4 Logistic Regression Analysis for Estimating Exacerbation of Chronic Obstructive Pulmonary Diseases