Figures & data
Figure 1 Identification of apoptosis and inflammation in the lung in an animal model of COPD. (A) Mouse lungs from the control and CS exposure groups after hematoxylin and eosin staining (10X, scale bar = 100 µm). (B) MLI of mice lungs (Student’s t-tests). (C) TUNEL staining in control and CS-exposed mouse lungs (40X, scale bar = 100 µm). (D) TUNEL-positive apoptotic cells in the control and CS exposure groups. (E) Prohibitin and p65 protein levels were determined by Western blot analysis. (F) Prohibitin protein levels were quantified by densitometry. (G) p65 protein levels were quantified by densitometry. *P < 0.05 vs control. **P < 0.01 vs control.
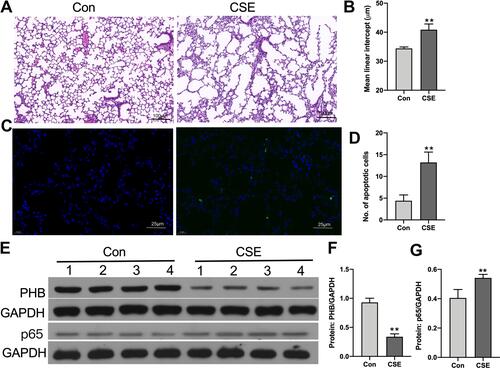
Figure 2 CSE treatment affects prohibitin expression of hPMECs. (A) hPMECs were treated with control medium or 1%, 1.5%, 2% and 2.5% CSE for 12 h. Prohibitin protein levels were determined by Western blot analysis. (B) Prohibitin protein levels were quantified by densitometry, and bar graphs represent three independent experiments (unpaired Student’s t-tests). (C) Relative mRNA levels were determined in hPMECs treated with control medium or 1%, 1.5%, 2% and 2.5% CSE for 12 h. *P < 0.05 vs control. **P < 0.01 vs control.
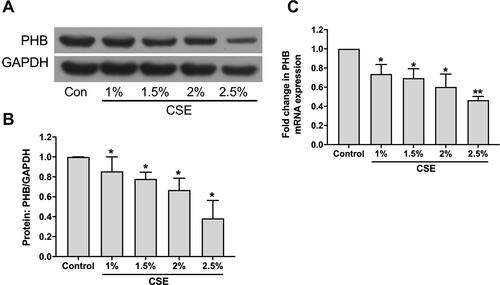
Figure 3 Prohibitin modulates changes in the Δψm and ATP content in hPMECs exposed to CSE. hPMECs were transfected with adenoviral PHB constructs for 2 h and cultured for 12 h or 48 h. (A) PHB content in hPMECs was detected by Western blot method a. hPMECs transfected with an empty vector or a prohibitin plasmid were challenged with or without 2.5% CSE for 12 h. (B) Representative cytometry plots of cells incubated with JC-1 probe (labeled with※). (C) Bar graph demonstrates the levels of MMP in different groups. (D) ATP content analysis in hPMECs with the indicated treatments. Bar graphs represent the results from three independent experiments. **P < 0.01 vs empty vector-transfected cells with control medium; ##P < 0.01, #P < 0.05 vs empty vector-transfected cells with CSE.
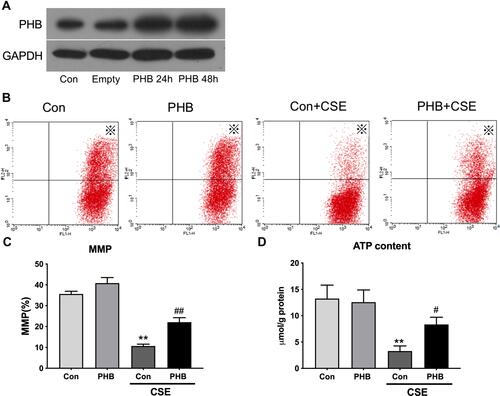
Figure 4 Prohibitin suppresses intracellular ROS in hPMECs exposed to CSE. hPMECs transfected with an empty vector or a prohibitin plasmid were challenged with or without 2.5% CSE for 12 h. (A) The level of ROS was determined by flow cytometry. (B) The level of ROS was determined by fluorescence microscopy. Original magnification×200. (C) Representative immunohistochemistry photographs of 8-OHdG expression. Original magnification×400. (D) Quantification of intensity by flow cytometry. (E) Quantification of density by fluorescence microscopy. (F) Quantification of 8-OHdG expression. **P < 0.01 vs empty vector-transfected cells with control medium; ##P < 0.01 vs empty vector-transfected cells with CSE.
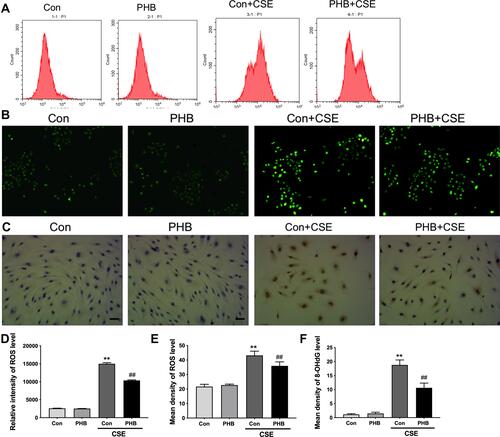
Figure 5 Prohibitin alleviates apoptosis of hPMECs exposed to CSE. hPMECs were transfected with an empty vector or prohibitin overexpression plasmid and then treated with or without 2.5% CSE for 12 h. (A) Representative pictures of apoptotic cells by flow cytometry. (B) Quantification of apoptotic cells by flow cytometry (labeled with※). (C) Cell lysates were harvested and immunoblotted for cleaved caspase-3. (D) Levels of mtTFA, Bax, Bcl-2 proteins were determined by Western blot. (E) The levels of Bax/Bcl-2 were quantified. (F) The levels of mtTFA were quantified by densitometry. The results are representative of three independent experiments. **P < 0.01 vs empty vector-transfected cells with control medium; ##P < 0.01 vs empty vector-transfected cells with CSE.
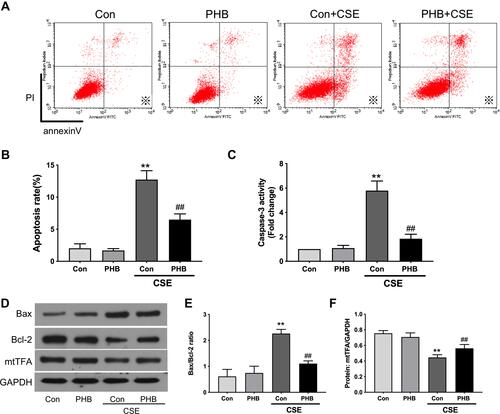
Figure 6 Prohibitin reduce transcription and release of pro-inflammatory cytokines in hPMECs exposed to CSE. hPMECs were transfected with an empty vector or prohibitin overexpression plasmid and then treated with or without 2.5% CSE for 12 h. The levels of (A) TNF-α, (B) IL-6 and (C) IL-1β in culture media was measured by ELISA.The levels of (D) TNF-α, (E) IL-6 and (F) IL-1β mRNA expression was determined by RT-PCR. **P < 0.01 vs empty vector-transfected cells with control medium; ##P < 0.01 vs empty vector-transfected cells with CSE.
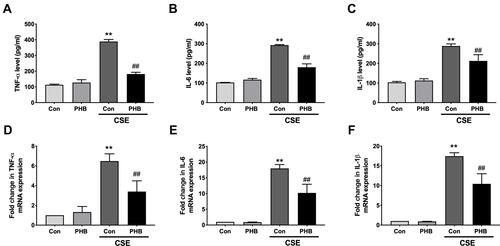
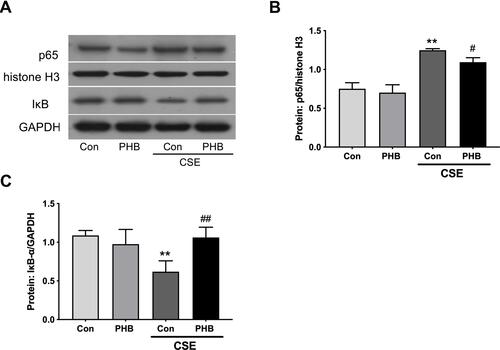
Figure 7 Prohibitin inhibits NF-κB pathway induced by CSE in hPMECs. hPMECs were transfected with an empty vector or prohibitin overexpression plasmid and then treated with or without 2.5% CSE for 12 h. (A) Nuclear extracts were subjected to Western blot analysis for NF-κB p65, histone H3 and whole cell lysates were prepared for IκBα and GAPDH was used as loading control. The levels of (B) nuclear NF-κB p65, and (C) IκBα were quantifed by densitometry. **P < 0.01 vs empty vector-transfected cells with control medium; ##P < 0.01, #P < 0.05 vs empty vector-transfected cells with CSE.