Figures & data
Table 1 Demographic and Baseline Characteristics
Table 2 PFT Parameters
Figure 1 Comparison of two lung function test parameters and imaging parameters. (A) Comparison of FEV1/FVC and DLCO/VC. (B) Comparison of R5, R20, R5-R20. (C) Comparison of Fres and Ax. (D) Comparison of X5. (E) Comparison of LC and EI of whole lungs. (F) Comparison of MED and MLD of whole lungs. Notes: *P < 0.05 compared with NS (no smoking); #P < 0.05 compared with FS (quit smoking).
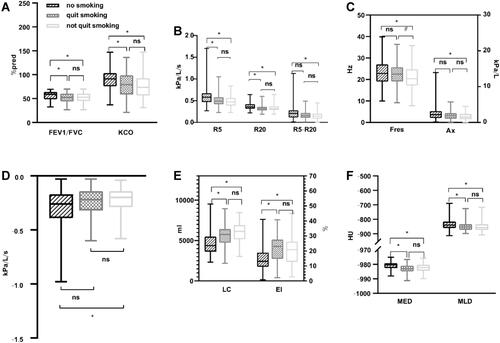
Table 3 Imaging Characteristics
Figure 2 (A) A 65 years old male of NS: FEV1=1.65L, FEV1/FVC=65.36%, KCO=100.6%, Z5%pred=99.7%, R5=0.28, R20=0.22, R5-R20=0.06, X5=−0.11, Fres=15.38, Ax=0.49, EI=13.68%, MLD=−841.91HU, MED=−979.35HU, LC=4823mL. (B) A 66 years old male of FS: FEV1=0.92L, FEV1/FVC=44.37%, KCO=96.5%, Z5%pred=174.3%, R5=0.46, R20=0.31, R5-R20=0.15, X5=−0.27, Fres=20.07, Ax=1.62, EI=26.85%, MLD=−850.85HU, MED=−988.4HU, LC=6004mL. (C) A 65 years old male of CS: FEV1=1.16L, FEV1/FVC=46.03%, KCO=71.9%, Z5%pred=242.5%, R5=0.64, R20=0.31, R5-R20=0.33, X5=−0.38, Fres=27.17, Ax=3.63, EI=25.19%, MLD=−874.26HU, MED=−981.88HU, LC=6905mL.
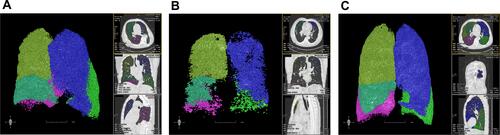
Table 4 Logistic Regression Analysis of Smoking and EI
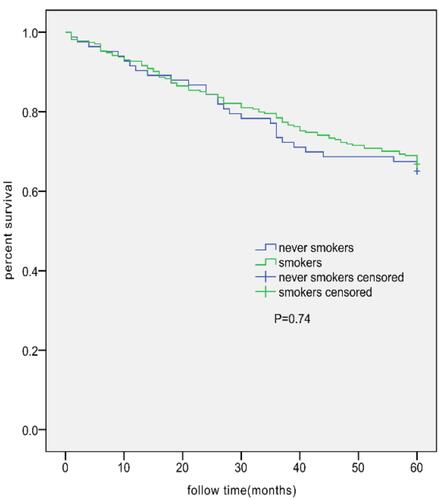
Figure 3 Kaplan–Meier survival curves for AECOPD patients in the NS group (n=83; 29 deaths) and all smokers AECOPD group (n=274; 91 deaths). No significant difference between the two groups was observed (log rank test, 0.113; P=0.74).