Figures & data
Table 1 Demographic Characteristics
Table 2 Clinical Characteristics During the 12-Month Baseline Period
Figure 1 Patient selection. aNo diagnosis of interstitial fibrosis, sarcoidosis, pulmonary embolism, or any malignancy (except basal or squamous cell skin cancer) during the baseline or follow-up periods.
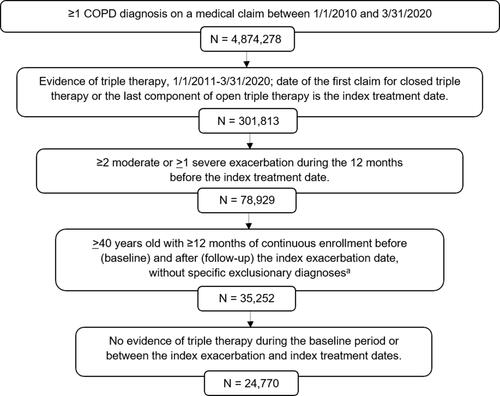
Figure 2 COPD medications and COPD-related pulmonologist visits during the 12-month baseline period. aTriple therapy within 30 days after or on the index exacerbation date; bTriple therapy between 31 and 180 days after index exacerbation; cTriple therapy between 181 and 365 days after index exacerbation.
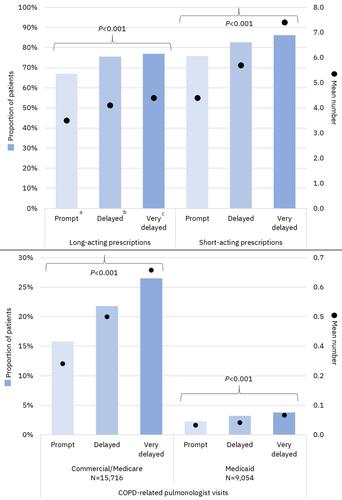
Figure 3 COPD exacerbations during the 12-month follow-up period. aTriple therapy within 30 days after or on the index exacerbation date; bTriple therapy between 31 and 180 days after index exacerbation; cTriple therapy between 181 and 365 days after index exacerbation.
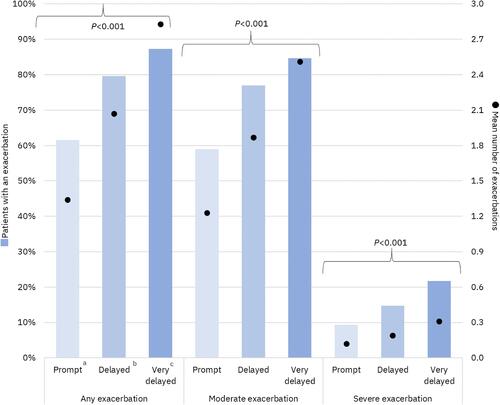
Figure 4 Adjusted odds ratios (95% confidence intervals) for all-cause and COPD-related healthcare resource utilization and COPD exacerbations during the 12-month follow-up period per 30-day delay of triple therapy. Results from logistic regression models controlling for age, sex, payer type, index exacerbation type (moderate vs severe), urban residence, index year, baseline comorbidities and tobacco use, baseline exacerbations, baseline short- and long-acting maintenance therapy use, nebulizer use, oxygen therapy, and number of COPD-related primary care provider and pulmonologist visits.
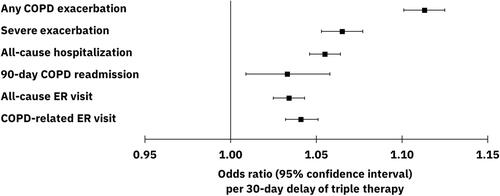
Figure 5 Adjusted mean number of COPD exacerbations (95% confidence intervals) during 12-month follow-up per 30-day delay of triple therapy. aP<0.001 for change in number of exacerbations per 30-day delay; results from a negative binomial regression model controlling for age, sex, payer type, index exacerbation type (moderate vs severe), urban residence, index year, baseline comorbidities and tobacco use, baseline exacerbations, baseline short- and long-acting maintenance therapy use, nebulizer use, oxygen therapy, and number of COPD-related primary care provider and pulmonologist visits.
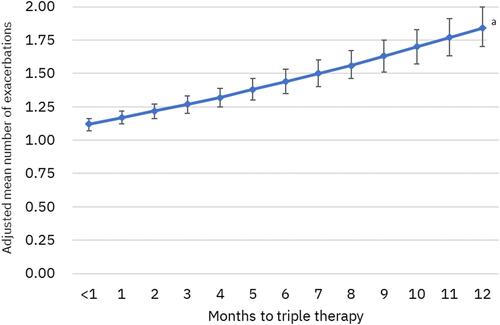
Table 3 All-Cause and COPD-Related Healthcare Utilization During 12-Month Follow-Up
Figure 6 All-cause and COPD-related healthcare costs of Commercial/Medicare patients during 12-month follow-up. aP values apply to costs for all service categories and total costs; bTriple therapy within 30 days after or on the index exacerbation date; cTriple therapy between 31 and 180 days after index exacerbation; dTriple therapy between 181 and 365 days after index exacerbation.
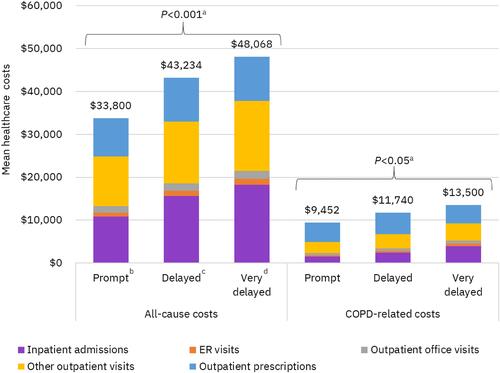
Figure 7 All-cause and COPD-related healthcare costs of Medicaid patients during 12-month follow-up. aP values apply to costs for all service categories and total costs; bTriple therapy within 30 days after or on the index exacerbation date; cTriple therapy between 31 and 180 days after index exacerbation; dTriple therapy between 181 and 365 days after index exacerbation.
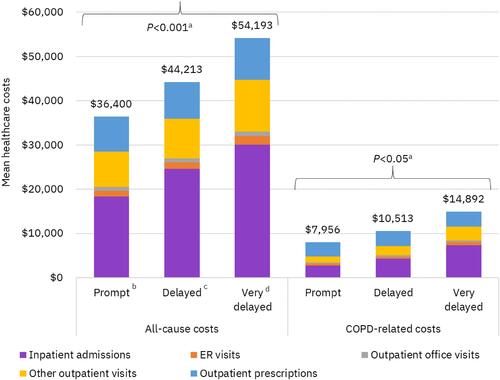
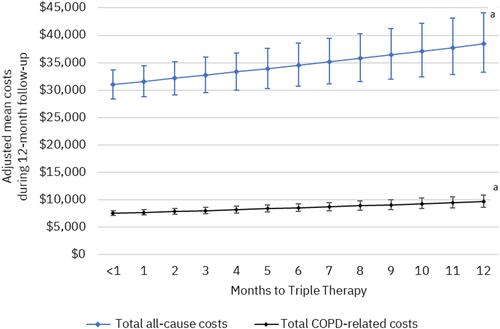
Figure 8 Adjusted mean healthcare costs (95% confidence intervals) per 30-day delay of triple therapy. aP <0.001; generalized linear regression models controlled for index exacerbation type and the following baseline characteristics: age, sex, insurance type, urban residence, index year, Elixhauser Comorbidity Index, tobacco use, baseline comorbidities (pneumonia, respiratory infection, cardiovascular disease, obesity, weight loss, number of exacerbations, any severe exacerbation, short- and long-acting maintenance therapy use, nebulizer use, oxygen therapy, number of COPD-related primary care provider and pulmonologist visits.