Figures & data
Figure 1 State transition diagram of Markov model.
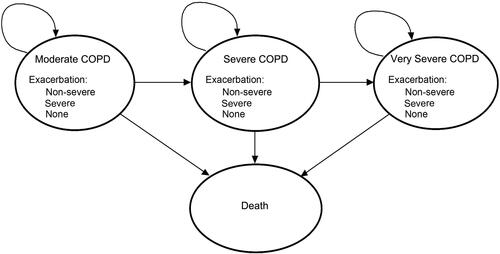
Table 1 Annual Transition Probabilities for Markov Model
Table 2 COPD-Related Mortality Risk by Age and Severity Stage
Table 3 Resource Use and Annual Costs (USD 2021) for Markov Model
Table 4 Cost-Effectiveness Analysis of Two Regimens
Figure 2 Cohort analysis model of UMEC/VIL group.
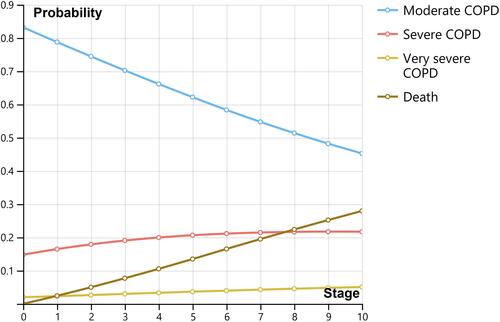
Figure 3 Cohort analysis model of FSC group.
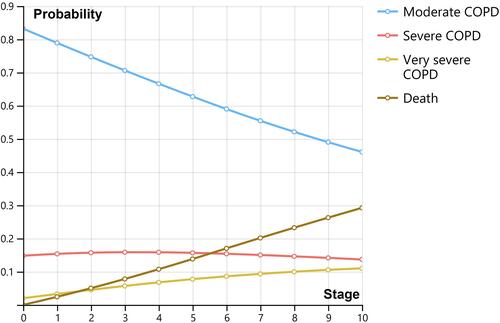
Figure 4 Tornado diagram (ICER, UMEC/VIL vs FSC).
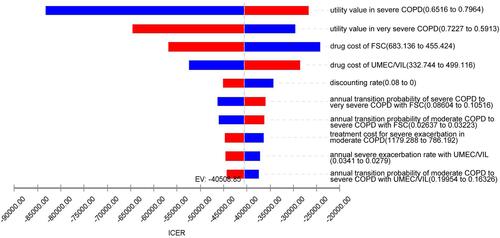
Figure 5 Scatter plot of incremental cost-effective of UMEC/VIL vs FSC.
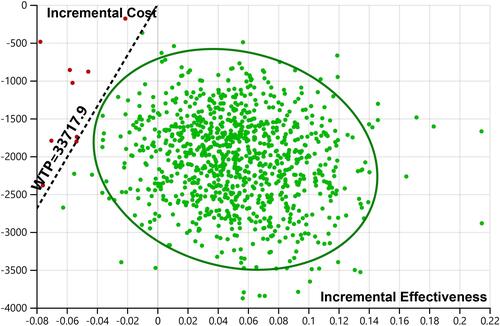
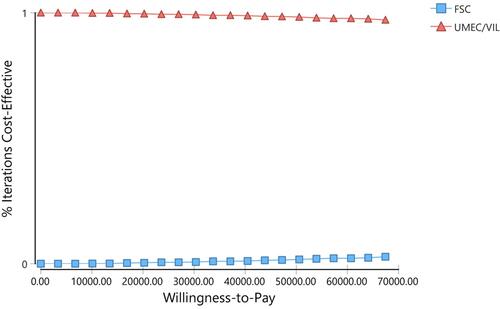
Figure 6 Cost-effectiveness acceptability curve of UMEC/VIL vs FSC.