
Figures & data
Figure 1 Attrition Diagram and Study Timeline. The attrition diagram presents the inclusion and exclusion criteria used to select the study patient population with a COPD diagnosis date in 2015. The study timeline includes a 12-month look back period in 2014; baseline history of exacerbations in YR1; and post-index exacerbations in YR2 and YR3.
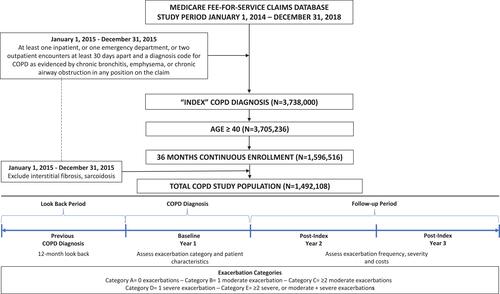
Table 1 Unadjusted and Adjusted Rate Ratios for Overall, Moderate and Severe Exacerbations in Post-Index YR2 and YR3 by Baseline YR1 Exacerbation Category
Table 2 Unadjusted and Adjusted All-Cause Costs (A) and Cost Ratios (B) for Exacerbation Categories B–E versus Category a in Post-Index YR2 and YR3 by Baseline YR1 Exacerbation Category
Table 3 Patient (A) and Clinical (B) Characteristics at Index Diagnosis Date at Baseline YR1 for Overall Chronic Obstructive Pulmonary Disease Cohort and for Exacerbation Categories A–E
Figure 2 Changes in exacerbation Categories A-E for Baseline YR1 and Post-Index YR2 and YR3. Exacerbation rates are displayed in the Sankey diagram, which visualizes transition between the five exacerbation categories from YR1 to YR2 to YR3. The width at each time point is proportional to the number of patients in the category. Exacerbations were defined as 0 (Category A), 1 moderate (Category B); ≥2 moderate (Category C); 1 severe (Category D); ≥2 exacerbations, at least one being severe (Category E).
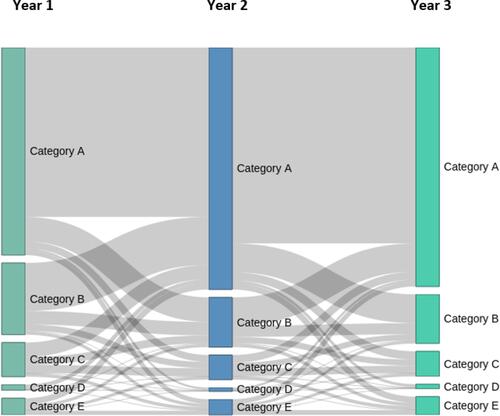
Figure 3 Moderate and Severe Exacerbation Rates Per 100-Patient-Years. The bar graph depicts the moderate and severe exacerbation rates per 100-patient-years for the overall cohort and by baseline exacerbation Categories A–E for post-index YR2 and YR3. Exacerbations were defined as 0 (Category A), 1 moderate (Category B); ≥2 moderate (Category C); 1 severe (Category D); ≥2 exacerbations, at least one being severe (Category E).
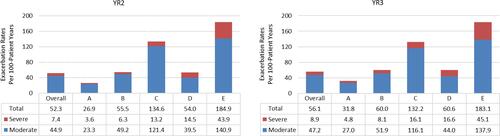
Figure 4 Percent of Patients with Single and Multiple Exacerbations. The bar graph depicts the percentage of patients with 1 and ≥2 exacerbations for the overall cohort and by baseline exacerbation Categories A-E for post-index YR2 and YR3. Exacerbations were defined as 0 (Category A), 1 moderate (Category B); ≥2 moderate (Category C); 1 severe (Category D); ≥2 exacerbations, at least one being severe (Category E).
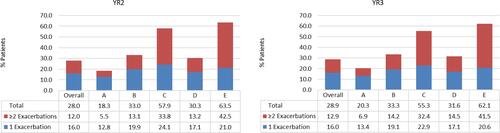
Table 4 Percentage of Patients with COPD Receiving Treatment for Overall Cohort and Exacerbation Categories A–E at Baseline YR1 and Post-Index YR2 and YR3