Figures & data
Figure 1 Schematic presentation of the flow of this study.
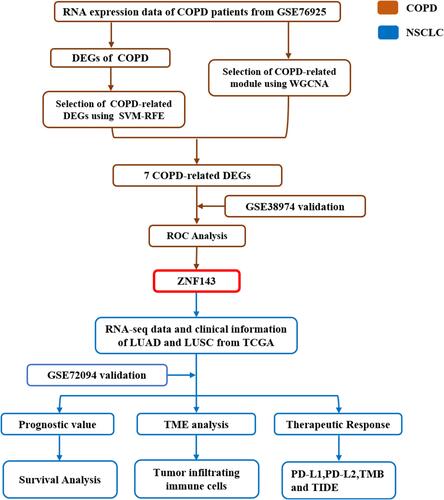
Figure 2 Identification of COPD-related key genes in the GSE76925 dataset. (A) Cluster dendrogram of the co-expression network modules, ordered by hierarchical gene clustering based on the 1-TOM matrix. Each module was allocated dissimilar colors. (B) Module-trait associations. Each row represents a color module while columns represent normal and COPD samples. (C) Scatter plot of module eigengenes associated with COPD in the green-yellow module. (D) Accuracy of the SVM-RFE algorithm. (E) Venn diagram of genes in the DEGs lists, co-expression green-yellow module and SVM-RFE algorithm.
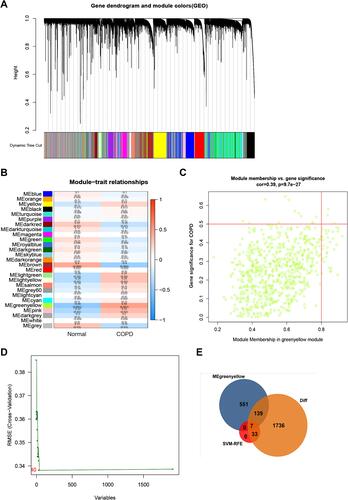
Table 1 ROC Analysis Results of ZNF143 in GSE76925 and GSE38974 Datasets
Figure 3 Levels of COPD-associated key genes in COPD vs normal based on GSE76925 (A) and GSE38974 (B) datasets.
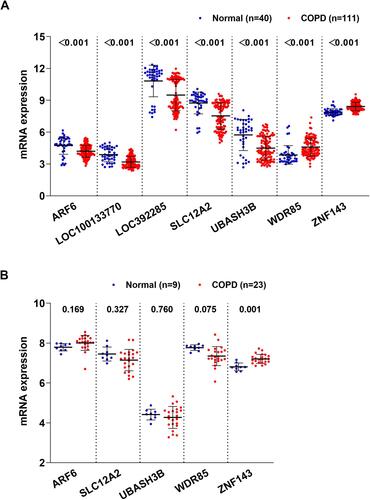
Figure 4 ROC curve analysis of ZNF143 expressions for predicting COPD risks for healthy controls in GSE76925 (A) and GSE38974 (B) datasets.
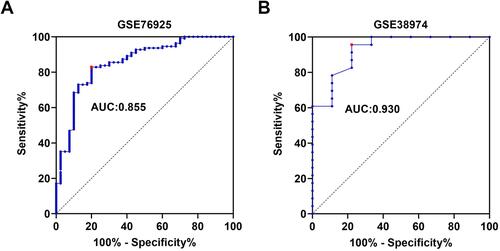
Figure 5 Elevated ZNF143 levels in LUAD and LUSC tissues. (A) Comparisons of ZNF143 mRNA levels in LUAD and normal lung tissues in TCGA dataset. (B) Comparisons of ZNF143 mRNA levels in normal LUSC and lung tissues in the TCGA dataset. (C) Comparisons of ZNF143 mRNA levels among normal lung tissues, LUAD without COPD and LUAD with COPD tissues in the TCGA dataset. (D) ZNF143 mRNA levels were also compared among normal lung tissues, LUSC without COPD and LUSC with COPD tissues in the TCGA dataset. (E) ZNF143 mRNA levels were compared between stage I–II and III–IV LUAD in the TCGA dataset. (F) ZNF143 mRNA levels were compared between various TNM stages of LUSC using the TCGA dataset.
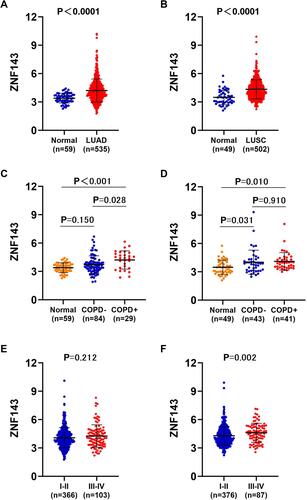
Figure 6 Associations between TICs abundance with ZNF143 levels in LUAD (A) and LUSC (B) tissues.
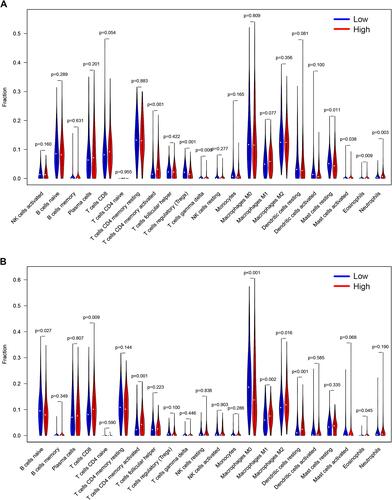
Figure 7 Mmunotherapeutic responses in ZNF143 high and low groups of LUAD and LUSC. (A and B) PD-L1 and PD-L2 levels in ZNF143 high and low groups in LUAD from TCGA. (C and D) PD-L1 and PD-L2 levels in ZNF143 high and low groups in LUAD from GSE72094. (E and F) PD-L1 and PD-L2 levels in ZNF143 high and low groups in LUSC from TCGA. (G and H) Comparisons of TMB values between groups in LUAD and LUSC from TCGA. (I and J) TIDE prediction scores of the two groups in LUAD and LUSC from TCGA.
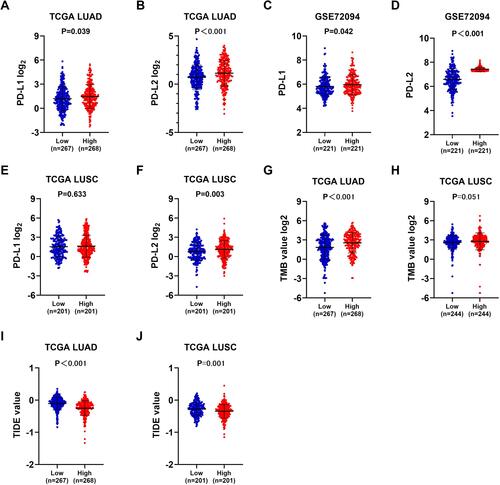
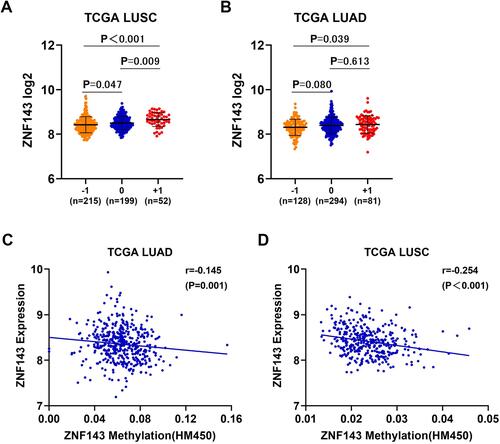
Figure 8 DNA copy gain and DNA methylation are involved in ZNF143 upregulation in NSCLC. (A and B) Comparisons of ZNF143 mRNA levels in various CNV groups in LUSC and LUAD. (C and D) Association analysis of ZNF143 mRNA levels and ZNF143 DNA methylation in LUAD and LUSC. −1, deep deletion and shallow deletion; 0, diploid; +1, gain and amplification.