
Figures & data
Table 1 Subject Demographics and Spirometric Characteristics Were Reported as Mean ± Standard Deviation Considering the Basic Group of Controls and COPD Volunteers, and Groups Taking the Glittre-ADL Test and Handgrip Strength as Reference. The Percentages of COPD Patients Presenting Abnormal Values According to Glittre-ADL Test and Handgrip Test Were 53.3% and 13.3%, Respectively
Figure 1 Oscillometric parameters in patients classified according to the ADL – Glittre test. R4, resistance at 4Hz (A); R20, resistance at 20Hz (B); difference between R4 and R20 (C), Cdyn, dynamic complacency (D); fr, resonance frequency (E); Ax, area under the reactance curve (F); Z4, respiratory impedance module (G); n, number of patients evaluated; ns, not significant; * p <0.05; ** p <0.01; *** p<0.0001.
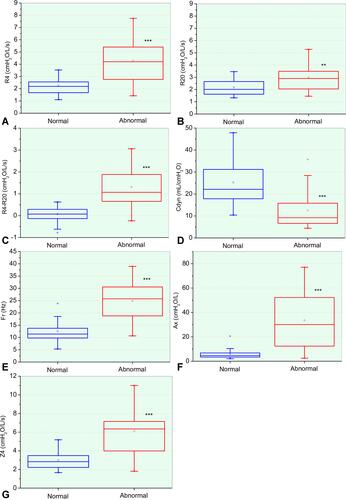
Figure 2 Oscillometric parameters classified in patients according to the Handgrip analysis. R4, resistance at 4Hz (A); R20, resistance at 20Hz (B); difference between R4 and R20 (C); Cdyn, dynamic complacency (D); fr, resonance frequency (E); Ax, area under the reactance curve (F); Z4, respiratory impedance module (G); n, number of patients evaluated; ns, not significant; * p <0.05; ** p <0.01; *** p<0.0001.
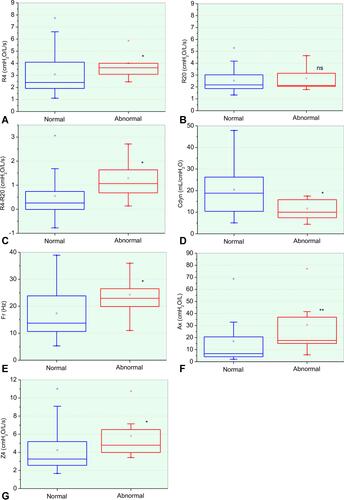
Table 2 Predicted and Measured Values in Patients with COPD for Total Glittre-ADL Test Time and Handgrip Analysis
Table 3 Correlation Analysis in Patients with COPD Describing the Association of Oscillometric Parameters with Total Glittre-ADL Test Time and Handgrip Analysis
Table 4 Accuracy of Oscillometry in Predicting Abnormal Functional Capacity in COPD Based on Glittre-ADL Test
Figure 3 Analysis of receiver operator characteristic (ROC) for the two best parameters observed in predicting exercise tolerance in COPD. Results for the analysis are based on the ADL – Glittre test (A) and Handgrip analysis (B).
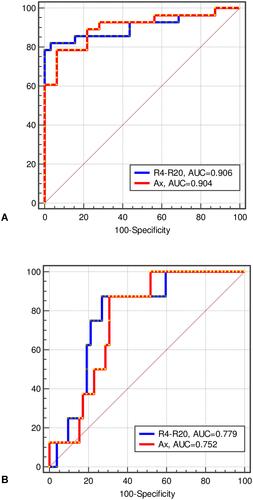
Table 5 Accuracy of Oscillometry in Predicting Abnormal Functional Capacity in COPD Based on Handgrip Evaluations